March 2016 continued the wet and cloudy season of previous few months. March 2016 was not blessed with many clear nights but still 856 orbits were collected in 23 nights. In March 2014, when 793 orbits were collected in 24 nights, 78,6% of the capacity of the 29 operational cameras could be used. In March 2015, 1033 orbits were collected in 23 nights when 75.5% of the capacity of the 42 operational cameras could function. In March 2016 only 62.6% of the capacity of the 50 operational cameras could be used. The larger number of operational cameras combined with the Auto CAMS at different stations compensated to some extend the worse weather conditions compared to previous years. Working under partially cloudy skies requires a lot of patience from the camera operators to distinguish the many false detections and to confirm the meteors. Scattered cloud cover reduces the chances to match simultaneous meteors. For this reason not all camera operators will decide to switch on the cameras when the sky conditions look rather hopeless, unless Auto CAMS is being used. The number of cameras and the perseverance of the camera operators resulted in a nice collection of orbits in spite of the rather poor weather.
According to Carl Johannink and Martin Breukers, 55 out of the 856 orbits could be matched to the IAU meteor shower list. More detailed results will be released later.
This report is based on the monthly list of simultaneous meteors provided by the network coordinator Carl Johannink to all CAMS participants.
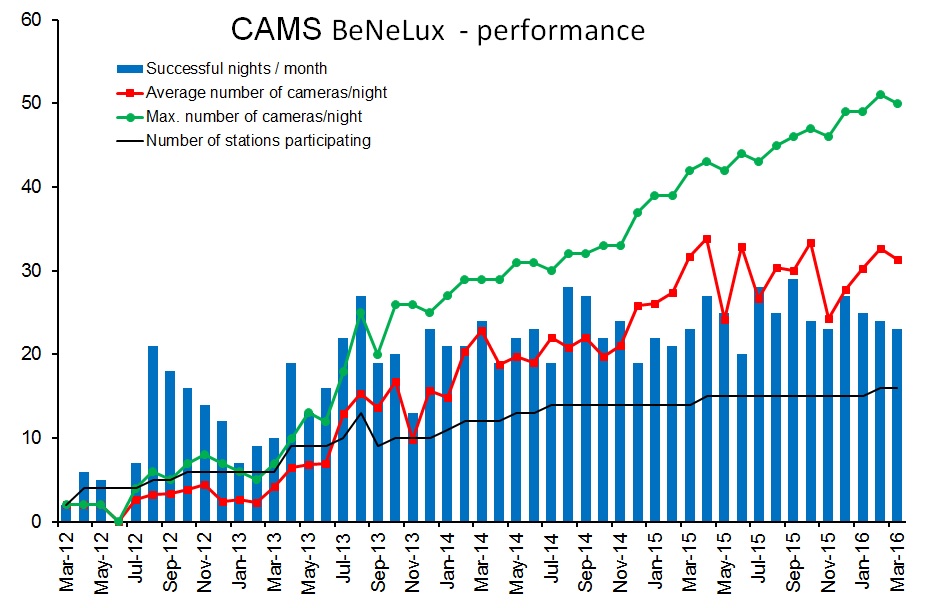
Figure 1 the blue bars depend mainly on mother nature (weather) and indicate the number of nights that orbits were successfully collected. The green line shows the maximum number of camera’s that could be operated per month. The red line is the average number of cameras functioning per night which depends on the weather and available number of cameras. The black line is the number of stations participating.
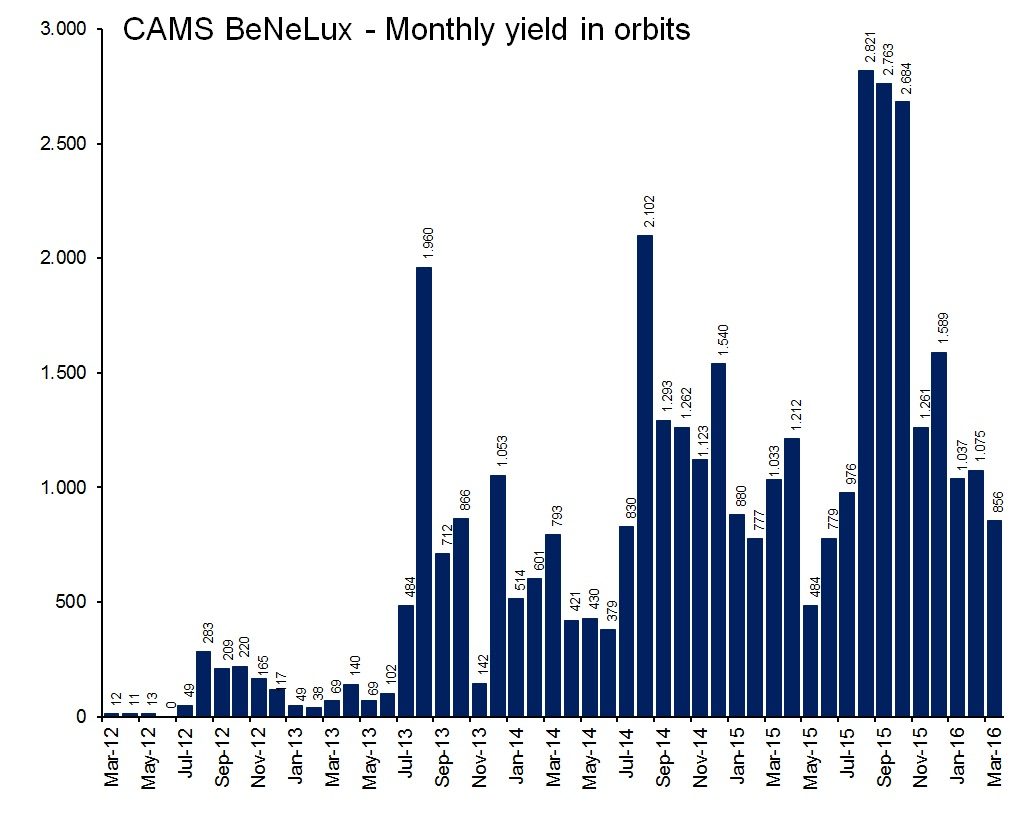
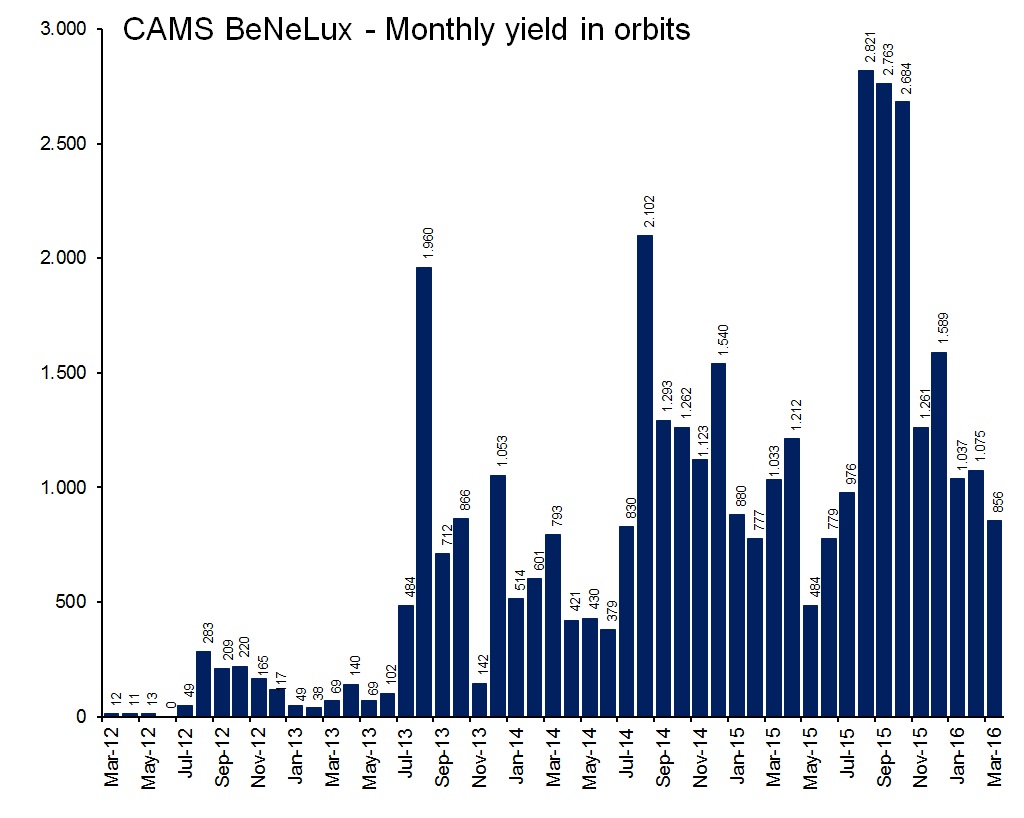
Figure 2 shows the number of orbits collected per month.
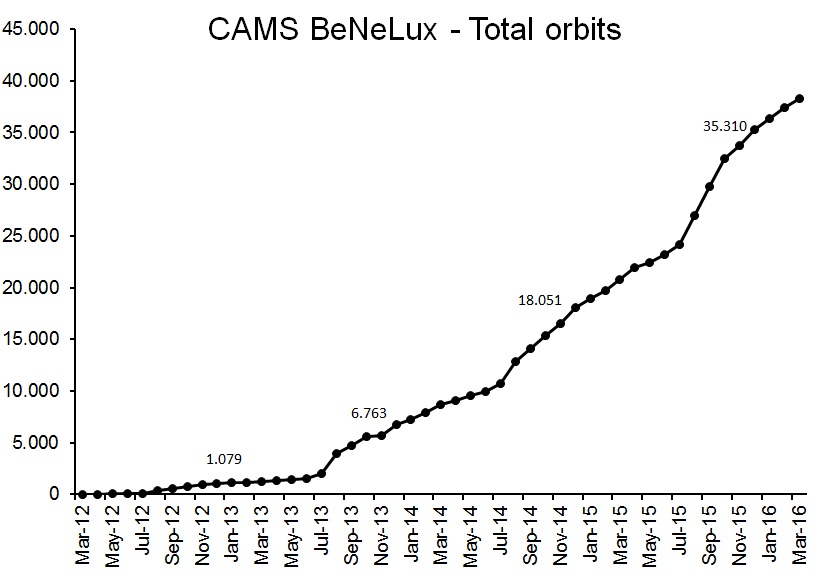
Figure 3 shows the total number of orbits collected by CAMS@Benelux so far. End March 2016 CAMS@Benelux had 38.278 orbits collected.


