You might think that the newly developed CAMS video system can get much more fine results than the system of SonotaCo network. There are small differences between them surely, but the comparison between the statistics of them reveals both data are comparable in accuracy. We find that the SonotaCo system cannot detect slow velocity meteors as good as CAMS but it is superior for faster meteors. There is a more important difference between them, that is, the definition of meteor showers and this is resulting in curious stream data.
1 Devices and software
Japanese meteor enthusiasts tried to use surveillance cameras (CCTV) in the 2000’s and the SonotaCo network published meteor data on the WEB (http://sonotaco.jp/doc/SNM/) for 2007–2016. First they intended to detect a meteorite fall and therefore they selected a wide field lens. Soon they noticed that a bright and short focus lens can catch more meteors than longer focus lenses. They have continued to use such lenses for example; the Watec WAT-100N, f6mm/F0.8. CAMS started its operation in 2010 and the devices are standardized as documented in Roggemans (2015). A CAMS camera can observe a field of view of 22.5 by 29.9 degrees, while a camera commonly used in Japan has a field of view of 56 by 43 degrees.
Japanese observers are using UFOCapture developed by SonotaCo and his useful computer software. The calculations and surveys can be easily carried out by any individual observer/researcher, while CAMS data are analyzed in a centralized procedure.
2 Data accuracy
CAMS data are now available only from October 21, 2010 to March 29, 2013 (Jenniskens et al., 2015). We therefore limited the use of SonotaCo data to 2010–13 and, then, the total amount of data becomes nearly equal.
It is easy to compare two observation systems by the statistics of two major showers; Perseids and Geminids, see Table 1a and Table 1b.
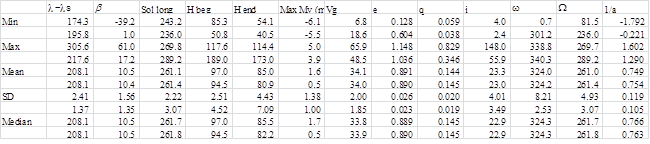
Table 1a – Geminids; the first line in each statistics shows the values for CAMS and the second line the values for SonotaCo.
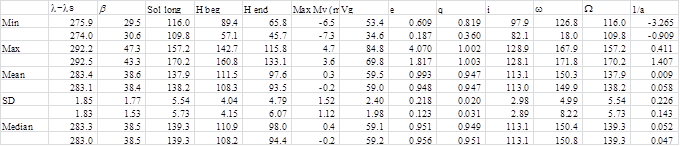
Table 1b – Perseids; the line order is same as Table 1a.
We can confirm that the two systems give a very similar mean/median and the standard deviations show that SonotaCo data seems to be better than CAMS. Further, you may notice the curious minimum and maximum radiant data (λ-λs, β) for CAMS. There are some clearly misplaced meteors among the Geminids and 9 meteors which belong to the HYD-shower should be excluded also. It seems there is some error in the search software of CAMS.
There is an excellent coincidence between both statistics. We realize that both systems can give results with the same accuracy for both slower as well as faster showers.
3 Observability in magnitude
CAMS uses a larger lens and, therefore, can detect fainter meteors than the optics used by the SonotaCo network. Figure 1 shows clearly our expectation. But, it shows that CAMS caught bolides more often than what we expect from the magnitude distribution curve itself. The SonotaCo’s distribution curve declines deeper for brighter meteors than CAMS. It is suggested that the magnitude measurement method is different in the two systems.
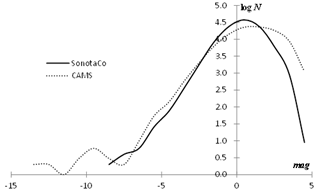
Figure 1 – Magnitude distribution of all recorded meteors by CAMS and SonotaCo network.
4 Observability in velocity
The author pointed out that the CCD observations (SonotaCo network) catch fewer meteors with a slow geocentric velocity than fast ones: “What do we see as ANT, Apex and Toroidal sources? – What are these meteors, where do these meteors come from, where are these meteoroids going?” (Koseki, 2015). Figure 2 shows the comparison between the CAMS and the SonotaCo network meteors. The main peak concerns the Geminids, the second is the Apex source and the third are the Perseids. Hyperbolic meteors (Vg > 74 km/s) are recorded more often in CAMS than in the SonotaCo network. CAMS can catch about twice as many slow meteors (Vg < 20 km/s) than the SonotaCo network, although the photographic meteors in this slow velocity range exceed the Apex sources.
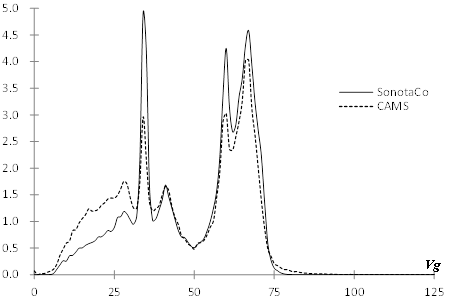
Figure 2 – Geocentric velocity distribution in percentage.
We can see the difference in the observability in velocity by comparing the moving mean magnitude per thousand meteors bin in function of the velocity (Figure 3). It is clear that CAMS can detect more faint meteors than SonotaCo over the whole range and the difference becomes larger for slower meteors. A shorter focal length camera records a meteor trail shorter than a longer lens such as used by CAMS. Fainter and shorter meteor trails might be rejected as noises in the SonotaCo network.
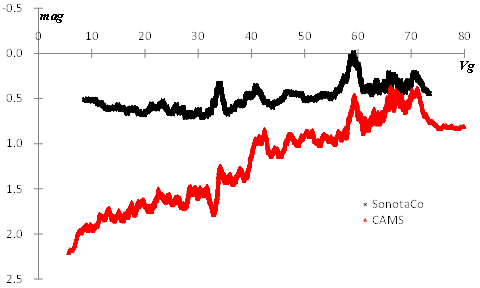
Figure 3 – Magnitude dependence on Vg.
If we suppose that CAMS can detect fainter meteors, we could expect that CAMS can record longer trails, that is, detecting more and go fainter. Figure 4 gives a contradictory result for the Geminid meteors; the SonotaCo network gets more long trails on average. In the case of the Perseids, the beginning heights (Hb) of CAMS shift more upward than for SonotaCo’s and they are located slightly above the latter. The end height (He) for the SonotaCo Perseids are clearly lower than those for CAMS and the trail lengths are longer in SonotaCo than for CAMS. UFOCatcher might work well for a moving object, because it was developed to detect such unknown objects for surveillance purpose.
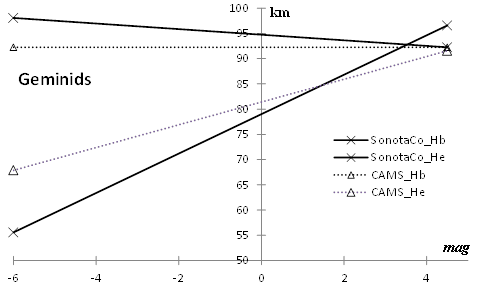
Figure 4 – Comparison of meteor trail length.
5 Meteor shower definition
The SonotaCo network uses a file named “ALL_SHOWER_NAMES” as definition and CAMS has a “CAMS StreamFinder”. The details of the latter are unknown but the former file has been published and is listed partially as example in Table 2.
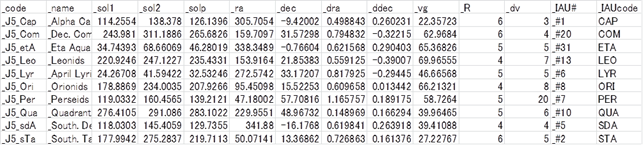
Table 2 – Examples of the shower definition table for the SonotaCo network.
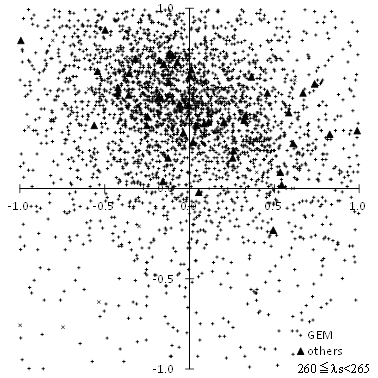
Figure 5 – Radiant distribution of GEM and DRG.
CAMS is splitting up the activity from a major shower into filaments. Figure 5 shows the radiant distribution around (λ–λs, β) = (208, 10). Here ‘others’ mean not Geminids but DRG, a new shower imposed by CAMS. The CAMS’ report (Jenniskens et al., 2016) describes the finding as follows;
“As a final curiosity, a group of unusual Geminids was found to have relatively high ~39.5 km/s entry speed (7σ above the median 33.8 km/s of other Geminids) and a resulting high i ~ 28° and semi-major axis a ~ 1.5–3.0 AU (Fig. 11). Based on the medium measurement error, we expected only 3 such outliers. These are here called the December ρ-Geminids (#641, DRG).”
But Table 1a shows that CAMS’ Geminids have a spread of SD = 2.00 in geocentric velocity and Figure 6 confirms the ‘curious’ situation with the DRG shower. The velocity distribution of DRG is well within that of the Geminids and therefore, the inclination of the orbits cannot be separated between GEM and DRG (see also Table 1a).
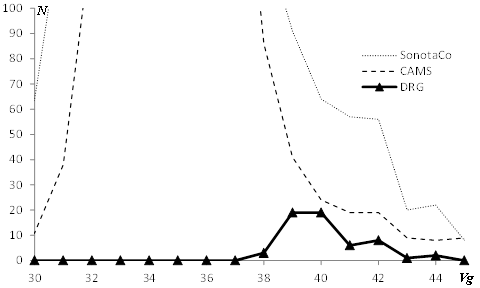
Figure 6 – Velocity distribution of GEM and DRG.
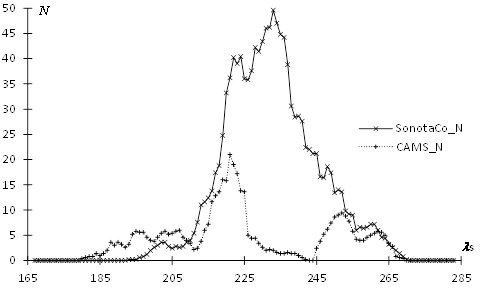
Figure 7a – Northern Taurids activity profile.
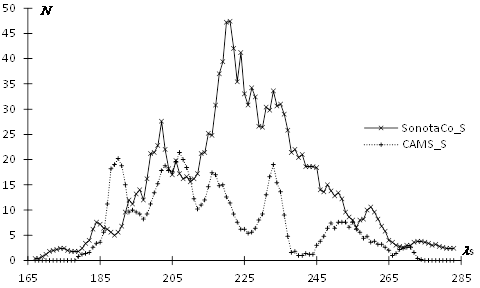
Figure 7b – Southern Taurids activity profile.
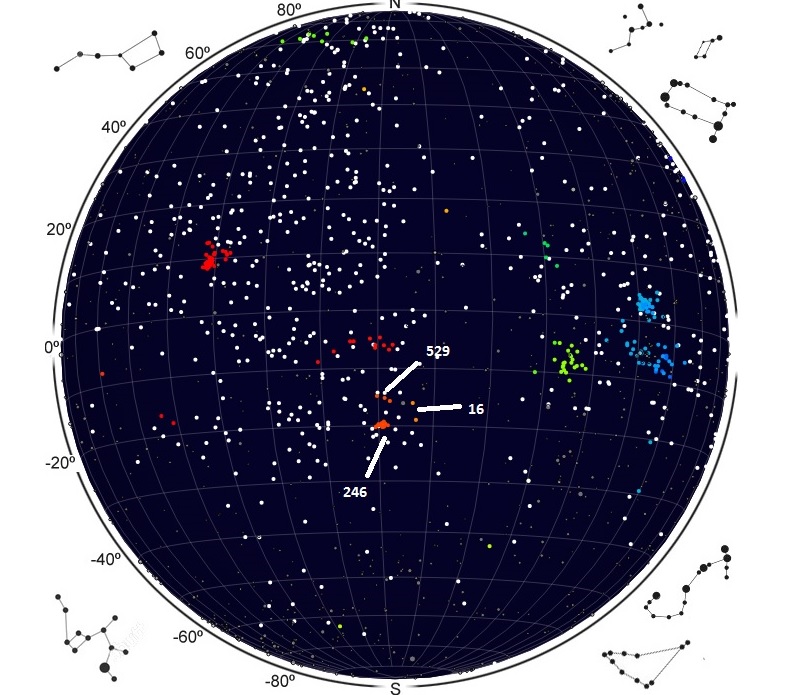
We can add one more shower with a strange definition from the CAMS data. Figure 7a and b show the Northern and Southern Taurids activity profiles by CAMS and SonotaCo network. Both SonotaCo’s curves seem natural but the CAMS’curves display irregularly cut-offs at the position of the ‘new showers’. We examine one of the most impressive dips near solar longitude 225 degrees. Figure 8 shows the radiant distribution around (λ–λs, β) = (190, 0) by CAMS. N and S are Northern and Southern Taurids as defined by CAMS respectively and, ‘others’ in the northern activity represents 632 NET (November eta Taurids) and in the southern branch 625 LTA (lambda Taurids). It is clear why the ‘Taurids’ activity in CAMS changes so irregularly.

Figure 8 – Radiant distribution of NTA, STA, NET and LTA.
The author found out that ‘Taurids’ have three components, that is, a northern and two southern branches (see Figure 7b, around λs = 205 and 225, (Koseki, 2012). But, ‘Taurids’ like listed in the IAUMDC are still in confusion and the author pointed out that the definition of a shower/stream differs from one to another (Koseki, 2016).
There are problematic shower definitions in the SonotaCo file (see Table 2). The author assumes that the readers are interested mostly in CAMS and does not describe such cases here.
6 Conclusions
We can find many discrepancies in two video observation systems but it is very important that individual data are published and can be used by other researchers to investigate further. We should be careful to quote the given results by the authors and we should know how to analyze the data provided by them.
References
Jenniskens P., Nénon Q., Albers J., Gural P. S., Haberman B., Holman D., Morales R., Grigsby B. J., Samuels D. and Johannink C. (2016). “The established meteor showers as observed by CAMS”. Icarus, 266, 331–354.
Koseki M. (2012). “Three components of ‘Taurids”. WGN, the Journal of the IMO, 40, 129–138.
Koseki M. (2015). “What do we see as ANT, Apex and Toroidal sources? – What meteors are, where meteors came from, where meteoroids are going”. WGN, the Journal of the IMO, 43, 127–146.
Koseki M. (2016). “Research on the IAU meteor shower database”. WGN, the Journal of the IMO, 44, 151–169.
Roggemans P. (2015). “CAMS Cameras for All sky Meteor Surveillance: Manual for the CAMS BeNeLux network”.


