In 2017, extensive analysis could be done on observations of the Southern Delta Aquariids (SDA). The results were compared with those from 2008 (Johannink et al., 2008a; Johannink et al., 2008b) and 2011 (Johannink et al., 2011a; Johannink et al., 2011b). Overall, we can conclude that the population index r and the ZHR showed the same trend in 2017 as in 2008 and 2011. The ZHR of the SDA rises rapidly between λʘ 122°-125° followed by a plateau in activity between λʘ 125°-127° (ZHR 20-25). This is followed by a slow decline in ZHR after λʘ 128°.
1 Introduction
From the Netherlands, the southern delta Aquariids are a hard-to-see meteor shower. With a radiant that does not exceed a height of 23 degrees, we see only a fraction of the actual activity of the meteor shower. This is already very different about 1000 km to the south in the Haute Provence, France. Hourly counts above 10 are possible. If you travel further south to Morocco or Crete, hourly counts around 20 are possible. For La Palma, the numbers are even higher, between 30-35 SDAs per hour. And under the top-conditions of Namibia, the maximum hourly rates are around 40. For many years it was assumed that the maximum ZHR was around 10–15, DMS observations from 2008 (Johannink et al., 2008a; Johannink et al., 2008b) and 2011 (Johannink et al., 2011a; Johannink et al., 2011b) from respectively La Palma and Namibia showed values with maximum ZHRs of around 20–30 during the period of 28 to 31 July. This means that this meteor shower can compete with the Orionids in good years (Rendtel, 2016).
With a New Moon on July 23, conditions were favorable in 2017 for a new analysis of the SDAs. However, this year’s problem is that only Michel Vandeputte and the author were active in southern regions, instead of the entire group of observers from 2008 and 2011. A good comparison with 2008 and 2011 is somewhat more difficult. In this article the result of the calculations are presented.
2 The available data
As mentioned, there was too little DMS data this year, so it was decided to browse the IMO database[1]. It was checked whether a reliable perception coefficient Cp was available for all observers who had provided data to the IMO. In addition, observations were only used for locations that are more southerly than 44° in latitude. Furthermore, observations were only used with limiting magnitudes better than +5.9 and radiant heights above 25 degrees.
The observations of the following observers passed these tests: Michel Vandeputte (Provence, France), Kai Gaarder (Norway, but observations made in Morocco), Javor Kac (Slovenia), Terrence Ross (Texas, US), Paul Jones (Florida , US), Robert Lunsford (California, US) and the author from Crete, Greece. The Cp is known for all these people, only a new Cp has been calculated for Terrence Ross.
After this entire process, 813 SDAs remained for the final analysis. This number of course contrasts sharply with the results from 2008 (1889 SDAs) and 2011 (3465 SDAs). In spite of this, an attempt was made to make a good analysis and to make a comparison with the data from 2008 and 2011.
[1] http://www.imo.net/members/imo_live_shower?shower=SDA&year=2017
3 Population index r for the SDA 2017
From the observations of Koen Miskotte in 2017, a mean magnitude gradient could be made on the basis of 323 SDAs. This resulted in Table 1. It is striking that as the period expires, the share of bright SDAs increases. See also Figure 1.
Tabel 1 – Magnitude distributions for the SDA 2017 from MISKO.
| λʘ | Night | Obs | -3 | -2 | -1 | 0 | +1 | +2 | +3 | +4 | +5 | Lm | Tot. | m |
| 122.041 | 24–25/7 | MISKO | 0 | 0 | 0 | 0 | 0 | 3 | 6 | 4 | 4 | 6.55 | 17 | 3.53 |
| 122.984 | 25–26/7 | MISKO | 0 | 0 | 0 | 0 | 0 | 3 | 6 | 9 | 4 | 6.37 | 22 | 3.64 |
| 124.888 | 27–28/7 | MISKO | 0 | 1 | 0 | 0 | 2 | 4 | 12 | 12 | 5 | 6.68 | 36 | 3.25 |
| 125.844 | 28–29/7 | MISKO | 0 | 0 | 0 | 2 | 4 | 7 | 18 | 26 | 10 | 6.69 | 67 | 3.37 |
| 126.800 | 29–30/7 | MISKO | 0 | 0 | 0 | 1 | 5 | 12 | 16 | 18 | 6 | 6.71 | 58 | 3.09 |
| 127.757 | 30–31/7 | MISKO | 1 | 0 | 1 | 4 | 3 | 16 | 15 | 16 | 9 | 6.70 | 65 | 2.85 |
| 128.723 | 31–01/8 | MISKO | 0 | 0 | 0 | 3 | 2 | 6 | 12 | 10 | 5 | 6.65 | 38 | 3.03 |
| 129.697 | 01–02/8 | MISKO | 0 | 0 | 3 | 2 | 1 | 3 | 4 | 4 | 3 | 6.64 | 20 | 2.35 |
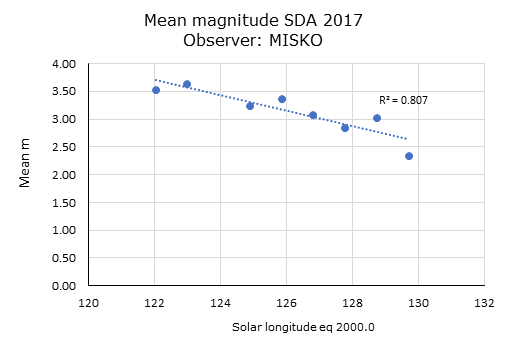
Figure 1 – Mean magnitude for the SDA 2017 based on observations of MISKO (323 SDAs).
The r value of the SDA, determined from all data from all above-mentioned observers, could best be determined from the distributions between magnitudes +1 and +5 and between magnitude 0 and +5. There were too few SDAs of –1 and –2. From this data Table 2 and Figure 2 could be distilled.
Table 2 – Population index r for the SDA 2017 [0;5] and [1;5].
| λʘ | Date |
r [ 1;5] |
n SDA | r[ 0;5] | n SDA |
| 120.270 | 22/23-7 | 3.12 | 14 | ~ | ~ |
| 121.225 | 23/24-7 | 2.44 | 17 | ~ | ~ |
| 122.180 | 24/25-7 | 3.06 | 32 | 31 | 32 |
| 123.136 | 25/26-7 | 3.03 | 54 | 3.22 | 55 |
| 124.092 | 26/27-7 | 2.33 | 39 | 2.31 | 41 |
| 125.048 | 27/28-7 | 2.84 | 140 | 2.74 | 146 |
| 126.004 | 28/29-7 | 3.02 | 172 | 3.03 | 177 |
| 126.960 | 29/30-7 | 3.47 | 101 | 3.52 | 103 |
| 127.916 | 30/31-7 | 2.79 | 150 | 2.56 | 161 |
| 128.873 | 31/01-8 | 2.42 | 76 | 2.41 | 81 |
| 129.829 | 01/02-8 | 2.19 | 31 | 2.21 | 33 |
| 130.786 | 02/03-8 | 1.90 | 21 | 2.10 | 22 |
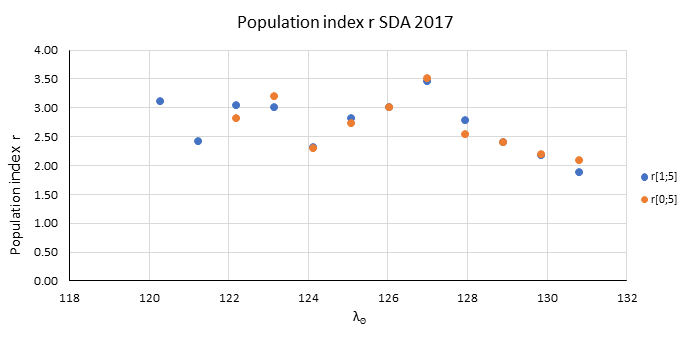
Figure 2 – Population index r for the Southern delta Aquariids in 2017. This is based on r[1;5] and r[0;5]. With the exception of the data point from the night 29–30 July (λʘ = 127°), the r value seems to confirm the impressions of Figure 1.
Subsequently, the value found for 2017 was compared with the r values for 2008 and 2011. In the analysis of 2008 and 2011 the r values were used r[–2;+5]. As a result of the much smaller dataset for 2017, we have now limited ourselves to r[0;+5] and r[+1;+5]. Figures 3 and 4 are the result. The r values for 2008 and 2011 r[0;+5] and r[+1;+5] were still available.
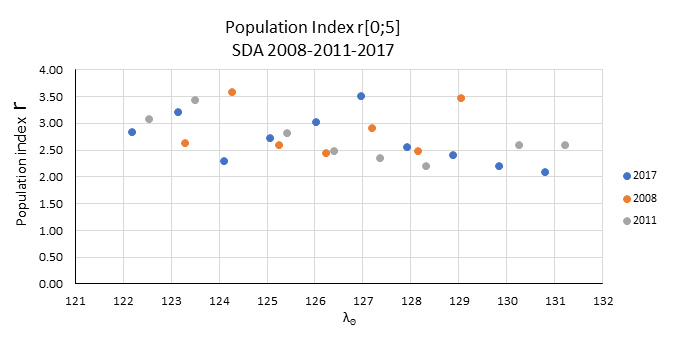
Figure 3 – Comparison of population index r[0-5] between the years 2008, 2011 and 2017.
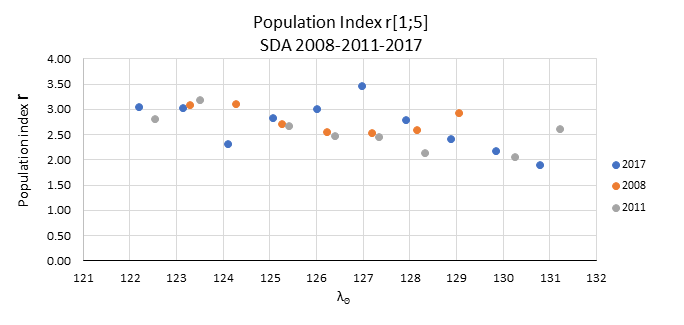
Figure 4 – Comparison of population index r[1; 5] between the years 2008, 2011 and 2017.
What stands out here is that 2017 seems to follow the years 2008 and 2011 reasonably well: from a high value of r (more weak meteors) to a lower value r (more bright meteors). Exceptions are points from the nights 29–30 July 2017 and 31 July – 1 August 2008.
An explanation of the higher r value in the night 29–30 July 2017 compared to 2008 and 2011 lies in the fact that there were few SDAs of 0 and +1 that night. The numbers of SDAs are therefore not a problem here. The higher r value from the night 31 July – 1 August 2008 compared to 2017 (in 2011 no observations were done in this night) is probably caused by a low number of SDAs as a result of a shorter observation period and by heavy Calima dust above La Palma. In addition, there are also sometimes considerable differences in the period before λʘ = 124°, this is due to the fact that the r values for the period for λʘ = 124° are based on (too) few SDAs. A single bright SDA can make a big difference in the r value.
So broadly speaking, the r value found from 2017 determined in the period λʘ 124°–131° reasonably follows the line from 2008 and 2011. The two mentioned exceptions aside. In the ZHR calculations we used r = 2.70, the average. This average value is close to the values found for 2008 (2.71) and 2011 (2.81).
4 The zenithal hourly rate ZHR
The ZHR was then calculated with the mean r value. The result can be found in Figure 5.
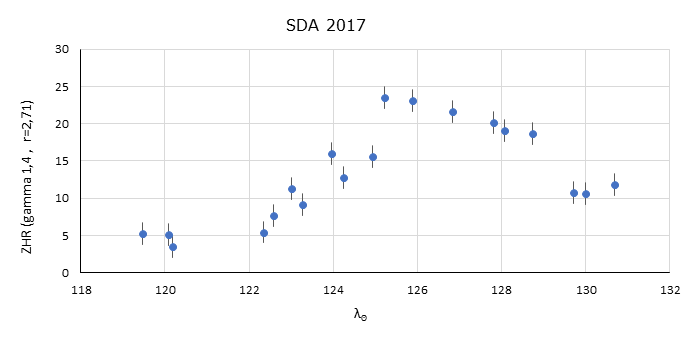
Figure 5 – ZHR graph Southern delta Aquariids 2017. The period shown runs from July 22 to August 3, 2017. This graph is based on 813 SDAs.
Figure 5 shows that the activity of the SDAs increases rapidly after July 25 and decreases less rapidly after the maximum. We also saw this effect in the years 2008 and 2011. See also Figure 6 for the comparison with the years 2008 and 2011.
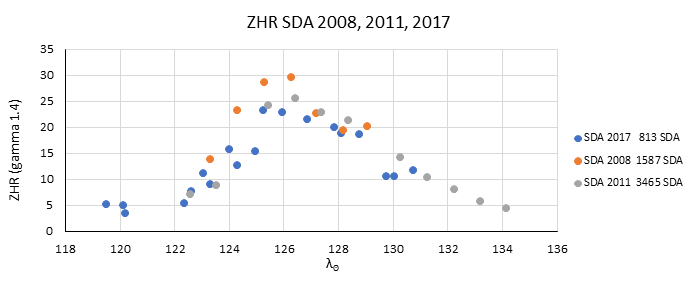
Figure 6 – The ZHR graph of the Southern delta Aquariids from 2017 compared to the ZHR graphs from 2008 and 2011.
It is striking that the graphs can be compared well with each other. The development is almost the same. The graph for 2008 is the highest with a ZHR that reaches up to 30. 2017 and 2011 are close together in terms of maximum activity: around 25. The rapid increase in ZHR after July 25, 2017 (λʘ = 122°) and the slow decrease after λʘ = 127° is also visible in 2008 and 2011.
The curve from 2017 is on average the lowest in the series 2008, 2011 and 2017. Whether this is a real effect cannot be said, because the differences are small. The observations were carried out under different circumstances (locations) and slightly different r values were used in 2008 and 2011. In 2008 and 2011 all were known DMS observers, in 2017 we also used data from active IMO observers. But thanks to the Cp, I do not expect that there is a problem here.
It would also be nice to set up another expedition to La Palma or Namibia to once again accurately determine the curve of the SDAs and see if we can confirm the results from 2008, 2011 and 2017.
5 Conclusion and recommendations
The Southern delta Aquariids showed a similar trend in 2017 as in 2008 and 2011. The ZHR seems to be slightly lower, but perhaps the cause can be found in the reduction method (in particular the population index determination) and / or the observing locations. The observation sites in 2017 were in fact more to the north than the much better locations from 2008 and 2011. All in all, the SDAs are a nice meteor shower that is certainly worth to observe visually. Useful visual data can only be obtained south of 44° latitude, the further to the south, the better.
It would be nice if more observers could supply data for this meteor shower, with at least 15 hours between 00h and 04h local time in the period at the end of July and August in order to be able to make a good Cp determination.
Acknowledgment
A word of thanks to Carl Johannink and Michel Vandeputte for the critical reading of this article and their useful comments. Also a word of thanks for the great efforts of all visual observers. Also thanks to Paul Roggemans for checking my English.
References
Johannink C., Miskotte K. and Jobse K. (2008a). “Resultaten van de Aquariiden-campagne op La Palma juli-2008”. eRadiant, 2008, 98–107.
Johannink C., Miskotte K., Jobse K., Vandeputte M. and van Leuteren P. (2008b). “Results of the Aquariid expedition to La Palma, July 2008”. WGN, 36, 139–146.
Johannink C. and Miskotte K. (2011a). “Resultaten van de Aquariiden-campagne in Namibië juli 2011”. eRadiant, 2011, 103–107.
Johannink C. and Miskotte K. (2011b). “Results for the Aquariid-expedition to Namibia, July 2011”. WGN, 40, 65–68.
Rendtel J. (2017). Meteor shower Calendar, IMO 2016.


It was very interesting to read this analysis Koen! Appreciate the time and effort you are putting down to make this happen! Keep up the good work, and good luck with the Geminids!
Regards Kai.
Hi Kai,
Thanks! I hope you are lucky to see the Genminids.
Clear sky’s!
Koen