Abstract: The AUD (#197) entry in the IAUMDC working list of meteor showers is confusing. The first reference orbit listed for AUD, AUD0, is a Harvard radar observation but very weak, slightly above the detection level. The second entry, AUD1, is a CAMS video observation and a conglomerate of two meteor shower activities; one should be named as ZDR that had been properly suggested by former researchers and the second one could be named AXD (August ξ-Draconids, preliminary name). ZDR (#73) in the IAUMDC list cannot be confirmed by other video observations. ZDR (#73) and AUD (#197) should be removed from the IAUMDC list or renamed by other more suitable names.
1 Introduction
The August Draconids (AUD#197) shower has been first found by Sekanina in the Harvard radar observations, but it may be another different stream activity than the later ‘AUD’ records. The IAUMDC lists two other AUD observations though these are possibly misled by the activity of the CDC (Cygnid-Draconid Complex, see Koseki, 2014b), especially by the AXD and ZDR showers (see Section 4 in detail).
ZDR in the IAUMDC list seems to be false. The author pointed out that ZDR is badly treated in the IAUMDC working list; the name of ZDR is not correctly used by Jenniskens (2006, page 721). He also commented that the ZDR shower is equal to the θ-Herculids. The first line of his ZDR entry suggests it is based on the source ‘BA’ but ‘BA’ is not listed in his book. Meanwhile, Koseki (2014b) pointed out that one of the members of the Cygnid-Draconid Complex coincides with the ZDR proposed by Terentjeva (1966) and Lindblad (1971).
It is necessary to clear out what is active during the activity period and in the area of ‘AUD’. We use the 2018 January 13 20h35m17s version of the IAUMDC meteor shower database. Meanwhile, the shower list has been changed suddenly without written explanations.
2 AUD (#197) in the Harvard radar observations
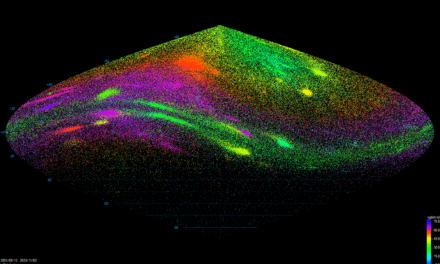
The first orbit reference for the AUD (#197) in the IAUMDC shower list is the Harvard radar observation in 1968–69 (Sekanina, 1976, see Table 1). Sekanina reported other series of radar observations in 1961–65 (Sekanina, 1973) and we refer to these simply as 61–65 and 68-69 observations hereafter. We had better checked the observations in detail at first. Figure 1 shows the radar radiant distribution with the reference meteor showers.

Figure 1 – Harvard radar radiant distributions in an azimuthal equidistant projection in ecliptic coordinates centered at (λ – λʘ, β) = (164.2°,88.2°) during λʘ = 132°~152°. The line λ – λʘ = 164.2 is the y-axis, the units are degrees. Symbols; shaded blue circles: 61–65 observations, black circles: 68–69 observations, red circles: are meteor showers listed in the IAUMDC (shaded) and the other important list (double), (Koseki, 2009). Radii are in accordance with D(M,N) values.
Table 1 – The summary data of AUD (#197) entries. 0197AUD02 is omitted because it is similar to 0197AUD01.
| Code | λʘ | α | δ | λ–λʘ | β | vg | e | q | i | ω | Ω |
| (°) | (°) | (°) | (°) | (°) | (km/s) | A.U. | (°) | (°) | (°) | ||
| 0197AUD00 | 142 | 272.5 | 65.1 | 164.2 | 88.2 | 17.3 | 0.335 | 1.007 | 30.4 | 185.6 | 141.9 |
| 0197AUD01 | 143 | 271.7 | 58.9 | 133.6 | 82.3 | 21.1 | 0.644 | 1.008 | 33.8 | 188.7 | 142.6 |
Larger circles, which are closer to the core of the stream, seem to be concentrated on the center, but it is an apparent effect. It is necessary to check whether this concentration means a real shower activity by the D(M,N) distribution; DSH values (Southworth and Hawkins, 1963) calculated between the mean orbit M and the individual orbits N. We calculate DSH values between the AUD0 (#197) orbit and all the Harvard radar meteors and show the result in Figure 2. The shape is very different from video data; major showers are buried in a monotonous profile contrary to the complex profiles with sharp peaks (see Koseki, 2020a). Meteor showers observed by radar look different compared to video ones. Radar showers cannot be detected by video and vice versa (Koseki, 2014a). We should exclude the prejudice that a meteor shower can be observed by all observational techniques.

Figure 2 – Distribution of D(M,N) values of 68–69 Harvard radar meteors for AUD0.

Figure 3 – Logarithmic cumulative distribution of D(M,N) values for 68–69 Harvard radar meteors; the supposed calculated sporadic distribution D(M,N) = 0.4~1.0 is shown by a dashed line.
Figure 3 shows the distribution on a logarithmic scale with the supposed sporadic distribution (dashed line). We should not consider all the meteors below the DSH limit, such as DSH < 0.2, as belonging to the meteor shower. There are even sporadic meteors with DSH < 0.1 naturally, because sporadic meteors are distributed randomly. We can estimate the real number of AUD meteors by the difference between the straight line and the dashed line in Figure 3. The numbers of supposed AUD are slightly above 0 within the range of DSH smaller than 0.2. Its activity may be very weak (Figure 4). Though Sekanina reported AUD by 68–69 observations (Sekanina, 1976), it is interesting whether AUD can be detected in the 61–65 observations. Figure 5 is the result of the 61–65 observations after processing the data in the same way as the 68–69 data and the AUD shower activity cannot be not certified from this 61–65 dataset.

Figure 4 – The estimated AUD meteors in 1968–69 with D(M,N); the difference of the real distribution in Figure 3 minus the supposed sporadics.

Figure 5 – The estimated AUD meteors in 1961–65, with D(M,N); the difference of the real distribution in Figure 3 minus the supposed sporadics.

Figure 6 – The distribution of D(M,N) < 0.2 meteors in function of λʘ, blue line for 61–65 data, red dashed line for 68–69 data.
We can find several possible AUD radiants with D(M,N) < 0.2, and their distribution along with λʘ seems interesting (Figure 6). These meteors make clear peaks around λʘ = 140° both in the 61–65 and the 68–69 observations. The 68–69 peak is much higher than that of 61–65. But these peaks are false; Harvard radar observations were intermittent (Figure 7). Both observation series intended to observe the Perseids and the observations were operated around the Perseid maximum. It is natural that the larger the total number of observations, the more D(M,N) < 0.2 meteors. It is unfortunate for us that there are no or very few observations between λʘ = 145~150 when the ZDR (not the IAUMDC’s ZDR, see following sections) reaches its maximum. We cannot confirm the AUD nor the ZDR activity in the Harvard radar observation series; we will continue the study of the AUD and the ZDR in the following sections.

Figure 7 – The sum of all radar meteors in 1 degree λʘ bins; radar operations were interrupted several times.
3 AUD (#197) in CAMS
The second entry of the AUD shower in the IAUMDC list is from CAMS, AUD1 (Table 1). But, AUD1 seems different from AUD0. Figure 8 gives the radiant distribution around AUD0 based on CAMS data; the plotting method is the same as in Figure 1. There are more D(M,N) < 0.2 radiants than in Figure 1. It is obvious that video meteors, which are brighter, are numerous in this field. This does not mean that the AUD0 activity is confirmed by CAMS observations. Many D(M,N) < 0.2 radiants belong to other showers (Figure 9 and Table 2). Figure 10 shows that CAMS did not catch the AUD0 activity. The number of D(M,N) < 0.2 meteors is obviously below the supposed sporadic distribution (dashed line). The geocentric velocity of AUD1 is some 4 km/s higher than AUD0. AUD1 is not equal or equivalent to AUD0; AUD1 seems to be another shower with brighter video meteors.

Figure 8 – CAMS radiant distribution around AUD0; centered at (λ – λʘ, β) = (164.2°,88.2°). The center position, the period and the radii of circles are done in the same way as in Figure 1.
Table 2 – The IAUMDC showers that appear in Figure 9, (x, y) represents the position in Figure 9.
| Code | λʘ | λ – λʘ | β | vg | x | y |
| (°) | (°) | (°) | km/s | |||
| 0012KCG10 | 135.8 | 161.2 | 71.9 | 23 | 0.9 | –16.3 |
| 0012KCG08 | 136.9 | 159.3 | 68.3 | 22.5 | 1.8 | –19.8 |
| 0012KCG05 | 137 | 155.7 | 72.7 | 22 | 2.5 | –15.3 |
| 0855ATD00 | 138.3 | 276.7 | 78.1 | 33.1 | -11 | 6.3 |
| 0012KCG04 | 140.7 | 161.5 | 71.9 | 21.9 | 0.8 | –16.3 |
| 0012KCG09 | 140.9 | 162.9 | 71.7 | 23 | 0.4 | –16.5 |
| 0012KCG07 | 141 | 147.7 | 75.8 | 20.9 | 4 | –11.9 |
| 0197AUD00 | 142 | 164.2 | 88.2 | 17.3 | 0 | 0 |
| 0197AUD01 | 143 | 133.6 | 82.3 | 21.1 | 3.9 | –4.8 |
| 0470AMD01 | 144.4 | 78.5 | 79.1 | 18.98 | 10.8 | 0.9 |
| 0012KCG02 | 145 | 176.4 | 79.5 | 24.8 | -2.2 | –8.4 |
| 0012KCG00 | 145.2 | 177 | 79.6 | 24.8 | -2.3 | –8.4 |
| 0012KCG01 | 145.2 | 158.1 | 74.5 | 24 | 1.6 | –13.6 |
| 0470AMD00 | 145.4 | 73.2 | 79.3 | 19.5 | 10.7 | 1.9 |
| 0197AUD02 | 146.5 | 112.4 | 81.1 | 21.1 | 7 | –3.7 |
| 0012KCG03 | 147.6 | 172 | 75.7 | 24.9 | -2 | –12.4 |
| 0470AMD02 | 149 | 59.5 | 82.9 | 21.3 | 6.9 | 3.6 |
| 0012KCG06 | 150 | 106.5 | 84.4 | 23.1 | 4.7 | –1.2 |

Figure 9 – The IAUMDC showers radiant distribution around AUD0. The center position and the period are the same as in Figures 1 and 8. The showers plotted in this figure are listed in Table 2.
Figure 11 shows all AUD1 meteors classified in the CAMS catalogue and we can see that the distribution curiously bends. Figure 12 reveals the cause for this unnaturalness. KCG is below left of the center and its distribution is elongated but not bent. CAMS’ AUD spreads from the center to right upward and left downward suggesting two elongated extents. Figure 13 strengthens the supposition that AUD1 consists of two shower activities; one reaching its maximum at λʘ = 140° and another around λʘ = 150°. We try to confirm these two components in the next section.

Figure 10 – Logarithmic cumulative distribution of D(M,N) values for CAMS meteors for AUD0; supposed calculated sporadic distribution D(M,N) = 0.4~1.0 is shown by a dashed line.

Figure 11 – The radiant distribution of AUD1 meteors classified in the CAMS catalogue centered at (λ – λʘ, β) = (133.6°,82.3°).

Figure 12 – The radiant distribution of CAMS meteors during λʘ = 120~160 centered at (λ – λʘ, β) = (133.6°,82.3°).

Figure 13 – AUD1 meteors classified according to the CAMS catalogue in 1 degree λʘ bins.
4 Recent observations on the CDC (Cygnid-Draconid Complex)
The author suggested at least four independent meteor shower activities in the Cygnus-Draco area in August (Koseki, 2014b) and confirmed these by three more recent video data sets; SonotaCo net, EDMOND and CAMS (Koseki, 2020b). These four shower activities have mistaken observers by their complexity. GDR (#184) crosses the KCG (#012) radiant path, the AXD (August ξ Draconids, preliminary name) runs parallel to the KCG and the early ZDR (#073) (not AUD (#197), see next section) activity overlaps with late AXD activity (Figure 14).

Figure 14 – Four meteor shower activities represented by EDMOND observations during λʘ = 120°~160° centered at (λ – λʘ, β) = (116°, 68°).
AXD was named KCG3 in the first paper (Koseki, 2014b) and marked as a steady shower activity and more active than the KCG in regular years (Table 3). AXD is located about 5 degrees west of the KCG and, therefore, not only visual observers but also video observers tend to misidentify AXD meteors as KCG.
Table 3 – The numbers of shower meteors classified in the SonotaCo net observations (Koseki, 2020b).
| Year | 2007 | 2008 | 2009 | 2010 | 2011 | 2012 | 2013 | 2014 | 2015 | 2016 | 2017 | 2018 | Total |
| GDR | 11 | 11 | 5 | 8 | 0 | 2 | 0 | 18 | 6 | 5 | 1 | 7 | 74 |
| KCG | 135 | 2 | 5 | 8 | 2 | 7 | 20 | 93 | 4 | 5 | 0 | 2 | 283 |
| AXD | 21 | 2 | 7 | 7 | 7 | 9 | 8 | 2 | 6 | 7 | 3 | 9 | 88 |
| ZDR | 2 | 1 | 11 | 14 | 3 | 15 | 7 | 1 | 1 | 2 | 7 | 5 | 69 |
Table 4 – The comparison between four CDC shower activities from earlier results (Koseki, 2014). The upper lines are the earlier results, the lower lines are the result for this study.
| Code | λʘ | λ – λʘ | β | α | δ | vg | e | q | i | ω | Ω |
| (°) | (°) | (°) | (°) | (°) | km/s | A.U. | (°) | (°) | (°) | ||
| GDR | 125.3 | 168.1 | 73.5 | 280.3 | 50.9 | 27.2 | 0.947 | 0.978 | 40.2 | 202.3 | 125.3 |
| 125 | 167.1 | 73.1 | 279.9 | 50.4 | 26.8 | 0.931 | 0.978 | 39.5 | 202.7 | 125 | |
| KCG | 141.4 | 164.4 | 70.9 | 287 | 49.6 | 22.3 | 0.703 | 0.968 | 33.8 | 206.5 | 141.4 |
| 140 | 163 | 71.7 | 285.4 | 50 | 22.1 | 0.698 | 0.973 | 33.7 | 205.4 | 140 | |
| AXD | 145 | 139 | 81.7 | 272.9 | 58.2 | 21.3 | 0.642 | 1.004 | 33.7 | 190.1 | 145 |
| 146 | 145.1 | 81.8 | 275.7 | 58.8 | 21.3 | 0.629 | 1.005 | 34.1 | 191.2 | 146 | |
| ZDR | 151.3 | 47.8 | 82.5 | 255.1 | 62.4 | 21.3 | 0.641 | 1.006 | 33.8 | 174.5 | 151.3 |
| 156 | 42.7 | 80.7 | 250.8 | 62.2 | 20.6 | 0.627 | 1.006 | 32.6 | 171.9 | 156 |

Figure 15 – The radiant distributions of the KCG and AUD by CAMS according to its own shower definition. Blue circles (left) are the KCG and red circles (right) are the AUD.

Figure 16 – Activity profiles for the KCG and the AUD by CAMS according to its own shower definition.

Figure 17 – Radiant distributions of the KCG and the AUD by SonotaCo net according to its own shower definition. Blue circles (left and center) are KCG and red circles (above the center) AUD.

Figure 18 – Activity profiles of KCG and AUD by SonotaCo net according to its own shower definition.
It is worthy to note the difference in the shower classification between the three video datasets; we can visualize the difference by comparing the activity profiles and the radiant distributions according to their own classification. Figure 15 represents the radiant distributions of the KCG and the AUD by CAMS. Compared with Figure 14 it is obvious that CAMS classified AXD meteors as AUD and clearly distinguished AXD from KCG. Figure 16 shows that CAMS extended the KCG activity to early July (λʘ < 95°) and the KCG in CAMS overflow Figure 15 leftwards below. SonotaCo net included AXD meteors as KCG but separated them from AUD (Figure 17). KCG seems strikingly more active than AUD in SonotaCo net (Figure 18) but this is caused because CAMS missed enhanced KCG activity while SonotaCo net had it twice. EDMOND inherits the definition of SonotaCo net and the results are similar to it (Figure 19 and 20); the sharp peak at λʘ = 126° is clearly due to the GDR activity.

Figure 19 – Radiant distributions of the KCG and the AUD by EDMOND according to its own shower definition. Blue circles (left and center) are KCG and red circles (above the center) AUD.

Figure 20 – Activity profiles of the KCG and the AUD by EDMOND according to its own shower definition.
It would have been better to search for the shower identification in the usual way rather than to use the classifications done by the networks in their own way. The author investigated the above mentioned four CDC shower activities (Koseki, 2020b) using his first study as the starting points (Koseki, 2014b). We use the mean radiant points and collect shower meteors by several iterations taking the radiant drift into consideration. The search periods are limited in time in order to exclude duplications in the shower identification (see Figure 14): GDR 119.6° < λʘ < 129.6°, KCG 130° < λʘ < 154°, AXD 135° < λʘ < 145°, ZDR 150° < λʘ < 160°. The summaries of the results are given in Table 4 and Figure 21. Both investigations are based on different methods but they are in good agreements. It is necessary to be careful that the activity profiles are limited according to the above-mentioned search periods. The hump in the profile of the GDR around λʘ = 140° is caused by another meteor shower activity, such as the AXD, which occurs on the path of the estimated radiant drift.

Figure 21 – Activity profiles by counting meteors taking the estimated radiant drift into account.
5 ζ-Draconids in photographic meteors
The name of ζ-Draconids owes to Denning (1899) and was reminded to us by Terentjeva (1966) and Lindblad (1971). Lindblad reexamined it later (Lindblad, 1995). Figure 22 shows his four shower activities with the radiant drift estimated from EDMOND observations. It is clear their ζ-Draconids coincide with our ZDR. This is why we call this activity not AUD but ZDR.

Figure 22 – Four meteor shower activities found by Lindblad (1995) with the radiant drift estimated from EDMOND observations. The paths of the radiant drift with their markers are extended both side from the examined periods (see text Section 4).

Figure 23 – The radiant distribution by SonotaCo net for the ZDR (#073). 112° < λʘ < 132°, centered at (λ – λʘ, β) = (33.2°,86.6°).

Figure 24 – Meteor shower activities in Figure 23 around ZDR(#073) by SonotaCo net.
We notice that the AXD shower activity is not mentioned by Lindblad (1995). 3 zeta Draconid meteors, 2 kappa Cygnids and 5 August Lyrids in Figure 22 might represent the AXD shower. It is very interesting that the KCG are divided into two activities: alpha Lyrids and kappa Cygnids. Lindblad studied shower activities by using a computerized discrimination criterion with DSH < 0.10. This level is obviously too small though it is suitable for short lived shower activities and for high precision meteors. Three out of the four activities, KCG, AXD and ZDR, are more than twenty days active (Figure 21) and the radiant areas are elongated even if we take the radiant drift into consideration. Many D-criteria assume that the position of the perihelion axis does not move and data are distributed spherically in the D space. In Figure 22 we can visually see the elongated radiant distribution and the radiant drift, but in case of an analysis on the basis of D-criteria we cannot handle such nature. When we use only one of the search methods, D-criteria or radiant distribution, we would obtain apparent and false results.
The entry for ZDR (#073) in the IAUMDC working list of meteor showers is problematic, because it was connected with θ-Herculids in the first IAU list (Jenniskens, 2006) and later this initial ZDR has been replaced by recent video data. The present ZDR in the IAUMDC list is quite different from the first one and from the θ-Herculids, and, moreover, we cannot find any trace of it (Figure 23 and 24). It is only based on single station video meteors.
6 Conclusion
This study confirms the author’s former results; we can confirm two meteor shower activities in the neighborhood of the KCG: ZDR and AXD (Table 4). AUD in CAMS consists of two shower activities, AXD and ZDR, and does not relate to AUD0. AUD in the IAUMDC list should be classified as ‘working’. The present ZDR in the IAUMDC list should be removed or renamed, because the ZDR stream has been known as a different meteor shower activity by several observers and researchers, Denning, Terentjeva and Lindblad, before the present ZDR were included in the IAUMDC list.
Acknowledgment
The author thanks the network coordinators and camera operators of SonotaCo net, CAMS and EDMOND for the availability of the orbit data used in this investigation.
References
Denning W. F. (1899). “General catalogue of the radiant points of meteoric showers and of fireballs and shooting stars observed at more than one station”. Mem. Roy. Astron. Soc., 53, 203–292.
Jenniskens P. (2006). “Meteor Showers and their parent comets”, Cambridge, Table 7, ‘Working list of cometary meteor showers’, 691–746.
Jenniskens P., Nénon Q., Albers J., Gural P. S., Haberman B., Holman D., Morales R., Grigsby B. J., Samuels D. and Johannink C. (2016). “The established meteor showers as observed by CAMS”. Icarus, 266, 331–354.
Kornoš L., Koukal J., Piffl R., and Tóth J. (2014a). “EDMOND Meteor Database”. In, Gyssens M., Roggemans P., Zoladek, P., editors, Proceedings of the International Meteor Conference, Poznań, Poland, Aug. 22-25, 2013. International Meteor Organization, pages 23–25.
Kornoš L., Matlovič P., Rudawska R., Tóth J., Hajduková M. Jr., Koukal J., and Piffl R. (2014b). “Confirmation and characterization of IAU temporary meteor showers in EDMOND database”. In, Jopek T.J., Rietmeijer F.J.M., Watanabe J., Williams I.P., editors, Proceedings of the Meteoroids 2013 Conference, A.M. University, Poznań, Poland, Aug. 26-30, 2013. Pages 225–233.
Koseki M. (2009). “Meteor Shower Records: A Reference Table of Observations from Previous Centuries”. WGN, Journal of the IMO, 37, 139–160.
Koseki M. (2014a). “Various meteor scenes I: The perception and the conception of a ‘meteor shower’”. WGN, Journal of the IMO, 42, 170–180.
Koseki M. (2014b). “Various meteor scenes II: Cygnid-Draconid Complex (κ-Cygnids)”. WGN, Journal of the IMO, 42, 181–197.
Koseki M. (2020a). “Problems in searching for meteor showers”. WGN, Journal of the IMO, 48, 99–107.
Koseki M. (2020b). “Cygnid-Draconid Complex (κ-Cygnids) II – Call for Observations κ-Cygnids 2021”. WGN, Journal of the IMO, 48, 129–136.
Lindblad B. A. (1971). “A Computerized Stream Search among 2401 Photographic Meteor Orbits”. Smithsonian Contributions to Astrophysics, 12, 14–24.
Lindblad B. A. (1995). “The orbit of the kappa Cygnids and related meteor streams”. Earth, Moon, and Planets, 68, 397–404.
Sekanina Z. (1973). “Statistical Model of Meteor Streams. III. Stream search Among 19903 Radio Meteors”. Icarus, 18, 253–284.
Sekanina Z. (1976). “Statistical model of meteor streams. IV-A study of radio streams from the synoptic year”. Icarus, 27, 265–321.
Southworth R. B. and Hawkins G. S. (1963). “Statistics of meteor streams”. Smithsonian Contributions to Astrophysics, 7, 261–285.
Terentjeva A. K. (1966). “Minor meteor streams”. In Collection of works ‘Meteor Investigation’, no. 1, from series ‘Investigation Results According to International Geophysical Projects’, Moscow. Nauka, pages 62–132. (In Russian).