
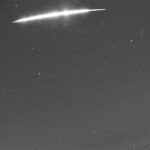
Figure 1. Beautifully composed 2.5 hour image of the tau Herculids outburst on May 31, 2022 over the famous Kitt Peak Observatory in Arizona. 19 tau Herculids and 4 sporadic meteors were recorded. In the foreground the building of the Bok 2.3 meter telescope and behind it the building of the 4.0 meter Mayall Telescope. Recorded by Jianwei Lyu. The image has also become APOD: https://apod.nasa.gov/apod/ap220601.html
On the night of May 30/31, 2022, a meteor outburst caused by dust from comet 73P/Schwassmann–Wachmann was observed from Europe and especially America. This article is based on calculations from the visual observations reported to the International Meteor Organization. The results are also compared with CAMS and radio observations.
Comet 73P/Schwassmann–Wachmann
In 1930, astronomers Arnold Schwassmann and Arno Arthur Wachmann discovered a comet while searching for asteroids. The comet was then 9.3 million km from Earth and completes one orbit around the Sun in 5.4 years. However, after this discovery, the comet was not seen for a while. This may have been due to a bad geometry relative to the Earth during perihelion, but it could also have been missed. The comet was rediscovered in 1979, but then missed again in 1985. In the fall of 1995, the comet was sighted again and found to be in outburst. Shortly thereafter, instead of one nucleus, four distinct nuclei, named “A”, “B”, “C”, and “D”, were observed. Since fragment C was the largest, it is believed that this fragment was the original large cometary nucleus. The next (unfavorable) appearance of comet 73P/Schwassmann–Wachmann was in 2000/2001, only fragments C and B were observed, which were brighter than expected.
The disintegrated comet made its next return to the inner regions of our solar system in 2006. It was a spectacular appearance that showed how comets come to an end. Initially, astronomers reported the two large fragments B and C and six smaller fragments G, H, J, M and N. But in the end 68 fragments were counted. Spectacular images from the Hubble and Spitzer Space Telescopes showed the fragmentation process in detail. Large and small pieces break off from the mother’s body and the then smaller fragments fall apart again. During that appearance, the author was able to observe the comet visually and photographically on several dates with an 80 mm telescope.
[Source: Kronk G., https://cometography.com/pcomets/073p.html]

Figures 2, 3, and 4. These beautiful images from Hubble (above) and Michael Jäger and Gerald Rhemann
shows the disintegration process of Comet 73P/Schwassmann–Wachmann.
Meteors from comet 73P/Schwassmann–Wachmann?
Because the comet’s orbit is close to Earth, several astronomers independently made predictions for meteor activity from this comet. However, no real evidence of meteor activity has been found in the past from a radiant near the star tau Herculi. The first hopeful model calculations showed that a meteor storm could possibly occur on May 31, 2022 from a radiant northwest of the bright star Arcturus in Bootes [Lüthen, 2001]. But some activity from the tau Herculids was also predicted for 2017, especially from the dust trail of 73P from 1941. Indeed, on the night of May 30/31, 2017, the CAMS BeNeLux network captured five tau Herculids within an hour exactly from the predicted radiant position by [Johannink, 2017]. Also, visual observers active in late May early June sometimes report very slow meteors from Bootes. This gave hope for a good activity in 2022. The initially predicted meteor storm in 2022 was later put into perspective by new model calculations: the expectations ranged from nothing at all to a few tens of tau Herculids per hour. However, due to the spectacular breakup of 73P/Schwassmann–Wachmann, some researchers expected [e.g., Rao, 2021] that there was a good chance for a meteor storm. It was mentioned that much would depend on the speed at which particles were released from the parent body 73P in 1995. The dust trail from 1995, the year of the first major break up of 73P/Schwassmann–Wachmann should be the largest supplier of activity, but also older dust trails could give some activity. Ultimately, the independent model calculations for the dust trail of 1995 yielded the following results as described in the IMO Meteor Shower Calendar [Rendtel 2021]:
May 31, 2022 04:55 UT (λʘ = 69.44° with a minimum distance of +0.0004 au [Jenniskens, 2006]
May 31, 2022 05:17 UT (λʘ = 69.459° with a minimum distance of -0.00214 au [Jenniskens, 2006]
May 31, 2022 05:04 UT(λʘ = 69.451° with a minimum distance of -0.00041 au (Sato, 2021)
These would mainly be weak meteors, because the tau Herculids have a very low entry speed of 16 km per second. The times mentioned were very favorable for Central and North America. In Europe the Sun is already above the horizon at the times mentioned, but it is possible that the rising flank of the outburst would be visible in Europe. Because there are multiple dust trails from the various fragments of 73P/Schwassmann–Wachmann near Earth, the IMO meteor calendar called for tau Herculid observations between May 28 and June 1. For example, two dust trails from 1892 and 1897 are mentioned that could give some activity on May 30, 2022 around 16 UT and May 31, 2022 around 10h UT respectively [Wiegert, 2005].
On May 30, 2022, Peter Jenniskens reported on Meteornews (Jenniskens, 2022a) the first detections of tau Herculids on May 27, 2022 by the CAMS global network. And also, the GMN network and the CMOR radar clearly detected activity of the tau Herculids. Radio observations (Ogawa, 2022) also show clear activity. Visual observers reported several to many tens of tau Herculids per hour in Europe and America [e.g., Martin, 2022; Miskotte, 2022]. This article presents the results of an analysis based on visual meteor observations reported to IMO up to June 25, 2022. The data is also compared with CAMS and radio observations.
Visual analysis
A number of European observers have taken the initiative to do observations from America, including Thomas Weiland, Sirko Molau, Javor Kac and Francisco Ocaña González. Via the website of the International Meteor Organisation (https://www.imo.net/members/imo_live_shower?shower=TAH&year=2022) the observational data could be checked on location and possible errors. When entering the observations, it was immediately checked whether the data met the known requirements. These requirements are:
- A good reliable Cp of the observer must be known, or there must be enough August data available from the previous year(s) to calculate a Cp.
- Only observations made with a limiting magnitude of 5.9 or higher are used for analysis.
- The minimum radiant height was set at 25 degrees.
- Only observations with cloud percentages of 10% or lower were used.
- Also 0 detection observations were used in this analysis.
Next, the magnitude distributions were checked for the following requirement:
- The difference between the observed mean magnitude of the meteor shower and the limiting magnitude should not exceed 4 magnitudes.
Population index r
The astronomers’ model calculations indicated that it would mainly involve many faint meteors. Indeed, many observers in the field noticed this. Nevertheless, a number of bright tau Herculids were also seen, as Mark Adams observing from Virginia counted two tau Herculids of -2 and one -3. Pierre Martin also saw a few bright tau Herculids from Canada: “The Tau Herculids seemed to be very fragile, delicate meteoroids — many extremely short paths. The brighter ones often had multiple flares and terminal flashes. The brightest Tau Herculids reached -3 and displayed thick wakes that seemed “sparkly” (fragmentation)”. Javor Kac was the only visual observer to observe a Tau Herculid fireball, which had a magnitude of -6. Astronomer Pavel Spurny reports that the Czech all sky network has captured 16 Tau Herculid fireballs, the brightest even at magnitude -15 [private com Betlem].
The population index r calculations seem to confirm that most tau Herculids were faint. Table 1 and Figure 5 give the results of these calculations.
| λʘ | r[-1;5] | Dev |
| 68.347 | ||
| 69.126 | 3.06 | 0.44 |
| 69.206 | 3.07 | 0.24 |
| 69.266 | 2.67 | 0.62 |
| 69.306 | 3.07 | 0.53 |
| 69.346 | ||
| 69.386 | 2.76 | 0.15 |
| 69.426 | 2.75 | 0.10 |
| 69.466 | 2.63 | 0.12 |
| 69.506 | 2.84 | 0.15 |
| 69.566 | 2.63 | 0.33 |
Table 1. Population index r[-1;5] of the tau Herculids

Figure 5. Population index r of the tau Herculids between May 30, 2022 20 UT and May 31, 2022 09 UT.
A cautious conclusion is that the tau Herculids had a slightly decreasing population index r between λʘ 69.05 and 69.60.
Zenital Hourly Count (ZHR)
The ZHR was determined as follows:

In addition, the radiant zenith exponent was set as γ = 1.0. The ZHR could be calculated using the population index r. In view of the activity shown, half-hour counts were chosen. Depending on how the observer provided his data, overlapping half-hour counts were used as much as possible. This is possible if an observer provides 10 minutes counts. The disadvantage is that observers who only provided counts on one subsequent 30 minutes have a smaller percentage in the processing than those who provided ten minutes counts. But the observational data shows roughly the same results, so there is a lot of confidence in the end result. Table 2 and Figure 6 give the results of these calculations.
| Jaar | Maand | Datum | t/m UT | λʘ ( ͦ) | Bins | n Obs | n TAH | ZHR | ~ |
| 2022 | 5 | 25 | 3.17 | 63.752 | 1 | 1 | 1 | 0.8 | 0.8 |
| 2022 | 5 | 29 | 0.37 | 67.342 | 5 | 3 | 4 | 0.7 | 0.4 |
| 2022 | 5 | 29 | 5.42 | 67.544 | 4 | 2 | 2 | 1.2 | 0.8 |
| 2022 | 5 | 29 | 22.50 | 68.227 | 4 | 1 | 11 | 3.2 | 1.0 |
| 2022 | 5 | 30 | 1.50 | 68.347 | 4 | 1 | 9 | 3.7 | 1.2 |
| 2022 | 5 | 30 | 3.43 | 68.424 | 2 | 2 | 2 | 2.8 | 2.0 |
| 2022 | 5 | 30 | 4.53 | 46.468 | 4 | 4 | 16 | 6.6 | 1.7 |
| 2022 | 5 | 30 | 5.70 | 68.515 | 2 | 2 | 9 | 3.2 | 1.1 |
| 2022 | 5 | 30 | 7.29 | 68.578 | 2 | 2 | 6 | 3.0 | 1.2 |
| 2022 | 5 | 30 | 9.98 | 68.686 | 1 | 1 | 2 | 5.1 | 3.6 |
| 2022 | 5 | 30 | 10.21 | 68.695 | 1 | 1 | 4 | 4.7 | 2.3 |
| 2022 | 5 | 30 | 20.17 | 69.093 | 1 | 1 | 7 | 10.3 | 3.9 |
| 2022 | 5 | 30 | 21.57 | 69.149 | 6 | 3 | 24 | 9.3 | 1.9 |
| 2022 | 5 | 30 | 22.39 | 69.182 | 6 | 4 | 25 | 10.6 | 2.1 |
| 2022 | 5 | 30 | 23.39 | 69.222 | 6 | 4 | 26 | 11.3 | 2.2 |
| 2022 | 5 | 31 | 0.43 | 69.264 | 6 | 5 | 22 | 8.3 | 1.8 |
| 2022 | 5 | 31 | 1.54 | 69.308 | 3 | 3 | 13 | 10.6 | 2.9 |
| 2022 | 5 | 31 | 2.58 | 69.350 | 3 | 3 | 16 | 18.4 | 4.6 |
| 2022 | 5 | 31 | 3.22 | 69.375 | 6 | 5 | 68 | 39.1 | 4.7 |
| 2022 | 5 | 31 | 3.38 | 69.380 | 11 | 6 | 129 | 43.2 | 3.8 |
| 2022 | 5 | 31 | 3.73 | 69.395 | 12 | 8 | 175 | 53.2 | 4.0 |
| 2022 | 5 | 31 | 3.95 | 69.404 | 14 | 9 | 244 | 65.0 | 4.2 |
| 2022 | 5 | 31 | 4.23 | 69.415 | 18 | 10 | 323 | 58.8 | 3.3 |
| 2022 | 5 | 31 | 4.46 | 69.425 | 20 | 10 | 383 | 51.5 | 2.6 |
| 2022 | 5 | 31 | 4.71 | 69.435 | 17 | 9 | 355 | 54.4 | 2.9 |
| 2022 | 5 | 31 | 4.95 | 69.444 | 16 | 8 | 352 | 57.9 | 3.1 |
| 2022 | 5 | 31 | 5.22 | 69.455 | 17 | 9 | 322 | 48.3 | 2.7 |
| 2022 | 5 | 31 | 5.55 | 69.468 | 24 | 12 | 365 | 40.5 | 2.1 |
| 2022 | 5 | 31 | 5.80 | 69.478 | 22 | 10 | 302 | 37.0 | 2.1 |
| 2022 | 5 | 31 | 6.19 | 69.494 | 15 | 8 | 157 | 28.6 | 2.3 |
| 2022 | 5 | 31 | 6.43 | 69.503 | 15 | 9 | 151 | 27.1 | 2.2 |
| 2022 | 5 | 31 | 6.66 | 69.513 | 12 | 8 | 116 | 26.8 | 2.5 |
| 2022 | 5 | 31 | 6.91 | 69.523 | 8 | 5 | 77 | 24.3 | 2.8 |
| 2022 | 5 | 31 | 7.20 | 69.534 | 6 | 4 | 45 | 14.1 | 2.1 |
| 2022 | 5 | 31 | 7.56 | 69.549 | 9 | 5 | 80 | 16.9 | 1.9 |
| 2022 | 5 | 31 | 8.59 | 69.589 | 5 | 3 | 88 | 12.8 | 1.4 |
| 2022 | 5 | 31 | 9.55 | 69.628 | 4 | 3 | 10 | 7.1 | 2.2 |
| 2022 | 5 | 31 | 10.25 | 69.656 | 3 | 3 | 6 | 6.9 | 2.8 |
| 2022 | 5 | 31 | 22.64 | 70.151 | 4 | 2 | 6 | 2.0 | 0.8 |
| 2022 | 6 | 1 | 0.49 | 70.225 | 3 | 2 | 2 | 0.8 | 0.6 |
| 2022 | 6 | 1 | 23.52 | 71.145 | 1 | 1 | 1 | 0.4 | 0.4 |
Table 2. Zenital Hourly Rate of the tau Herculids in 2022

Figure 6. ZHR of the tau Herculids between May 29 and June 2, 2022.
In Figure 6 shows that there was clearly visually detectable activity in the nights around the maximum. The ZHR was always around 1 to 3. In Figure 7 we zoom in on the maximum more in detail.

Figure 7. ZHR tau Herculids between May 30, 2022 20 UT and May 31, 2022 11 UT.
In Figure 3, the European part of the data is the interval between λʘ = 69.09 to 69.35°, this is May 30, 2022 from 20h UT to May 31, 2022 2.5h UT. During that period the ZHR was stable around ZHR=10. At the end of the night in Europe on May 31, 2022 around 3h UT, the onset to the peak was noticeable. Btw, this does not apply from the Canary Islands, where it remained dark until just after 5h00m UT, where, among others, Jürgen Rendtel and Rainer Arlt observed the tau Herculids.
At λʘ=69.40° (May 31, 2022 just before 4h00m UT) a first early peak is observed, the ZHR is then around 65 ± 4. The activity then decreases slightly to around 50 around λʘ= 69.444° (May 31, 2022 just before 5h00m UT), but then again had a peak with a ZHR of 58 ± 3. After the second peak, activity slowly decreases and from λʘ=69.60° (May 31, 2022 09h UT) the activity remained below a ZHR of 10. The rising edge of the peak is also somewhat steeper than the decreasing edge.
If we compare the two peaks found with the predictions mentioned above, it is noticeable that the second peak with a ZHR of 58 coincides very nicely with the first prediction of Peter Jenniskens (May 31, 2022 04h55m UT), but of course it should be mentioned that all predictions were very close.
Finally, in Figure 8 we give a comparison with the population index r. It is clear that the population index r begins to decrease as the outburst began.

Figure 8. ZHR and population index r in one graph.
Comparison with radio- and CAMS observations
In an article in Meteornews Hiroshi Ogawa (2022) published results of the worldwide radio observations of the tau Herculids. Here the radio observations are converted to activity profiles such as activity index and radio ZHR. Although the observation techniques are completely different, there is a possibility to (carefully) compare the radio ZHR with the visual ZHR. The method to estimate the radio ZHR is described in (Sugimoto, 2017). In [Ogawa, 2022, see Figure 4) a graph provides a detailed picture of the tau Herculids outburst. The author recognized two possible structures here, one small peak around λʘ=68.9° falls in the time window in which dust from 1892 and/or 1897 meteors may be generated as predicted by Wiegert (Wiegert, 2005). The largest activity (the second peak) comes from the dust from the big break up of 73P in 1995. The graph has been remade by the author (see Figure 9) and the visual ZHR curve has also been added. Unfortunately, the first (fainter) peak around λʘ=68.9° cannot be confirmed visually, simply because there is no observational data from the period λʘ=68.8-69.0°. The second peak in the radio data coincides nicely with the peak found from visual observations, although the visual level is much higher visually. Radio and visual meteor observations are always difficult to compare, but the broad outlies are usually there.

Figure 9. Comparison between the activity of the tau Herculids estimated radio ZHR and visual ZHR.
CAMS observations (Jenniskens, 2022) shows a maximum on May 31, 2022 at 04h42m UT ± 25 minutes. The second maximum found on May 31, 2022 at 04h57m UT in the visual analysis fits well in the period specified by Jenniskens.
Conclusion
The tau Herculids showed clearly observable activity in 2022. Based on visual observations, a maximum was found that appears an hour earlier than predicted. The ZHR was then 65 ± 4. A second slightly weaker peak with a ZHR of 58 ± 4 was found at the correct time. Comparison with radio and CAMS data gives comparable maximum times.
Acknowledgment:
First of all, of course, for all observers who have observed the tau Herculides. These are: Mark Adams, Daniel Alcazar, Rainer Arlt, Orlando Benitez Sánchez, Tim Cooper, Howard Edin, Aldo Nicolas Frezzi, Christoph Gerber, Robert Harris, Jan Hattenbach, Carl Hergenrother, Glenn Hughes, Javor Kac, André Knöfel, Pete Kozich, Jens Lacorne, Anna Levin, Michael Linnolt, Robert Lunsford, Oleksandr Maidyk, Oscar Martin Mesonero, Pierre Martin, Marco Micheli, Russel Milton, Koen Miskotte, Sirko Molau, Edward Murphy, Basil Nikolau, Artyom Novichonok, Francisco Ocaña González, Sasha Prokofyev, Ina Rendtel, Jurgen Rendtel, Terrence Ross, Ivan Sergey, Wesley Stone, Fengwu Sun, Hanjie Tan, Austin Uhler, Michel Vandeputte, Alan Webb, Thomas Weiland, Frank Wächter, Sabine Wächter and Quanzhi Ye.
In addition, a word of thanks to Carl Johannink and Michel Vandeputte for proof reading the article. Thanks to Paul Roggemans for checking my English. Special thanks to Hiroshi Ogawa and RMOB for providing the radio data.
References
- Jenniskens P. (2022a). “Anticipating a meteor outburst: global CAMS video network detects first 2022 tau Herculids”. eMetN, 7, 228-229.
- Jenniskens P. (2022b). “Tau Herculids outburst observed by CAMS”. eMetN, 7, 230-231
- Ogawa H. (2022). “A meteor outburst of the t-Herculids 2022 by radio worldwide meteor observations”. eMetN, 7, 232-235.
- Lüthen H., 2001, Arlt R. and Jäger M. (2001). “The Disintegrating Comet 73P/Schwassmann Wachmann 3 and its Meteors”. WGN, the Journal of the IMO, 29, 15–28
- Johannink C., van’t Leven J., and Miskotte K. (2017). “Tau Herculids in 2017 observed by CAMS”, eMetN, 2, 102-104 .
- Rao J. (2021), Will Comet 73P/Swassmann-Wachmann 3 produce a Meteor Outburst in 2022? Journal of the Royal Astronomical Society of Canada, 115, p62-71.
- Wiegert P. A., Brown P. G., Vaubaillon J., and Schijns H. (2005). “The τ Herculid meteor shower and comet 73P/Schwassmann-Wachmann 3”. Monthly Notices of the Royal Astronomical Society, 361, 638-644.
- Marsden, B., CBET 5126, http://www.cbat.eps.harvard.edu/iau/cbet/005100/CBET005126.txt
- Rendtel J. (2021). “2022 Meteor Shower Calendar”. International Meteor Organization
- Sugimoto H. (2017). “The New Method of Estimating ZHR using Radio Meteor Observations”. eMetN, 2, 109–110.
- Martin, P., in press eMeteornews
- Miskotte K. 2022, eMeteornews, online publication: https://www.meteornews.net/2022/08/16/meteor-observations-from-any-martin-rieux-may-june-2022-northern-france/


