UKMON team created series of scripts using analytical suite R to automatically process and summarize meteor data our network produces. Peter Campbell-Burns has extensive experience in data analysis which helped us to create this idea of semi-automated process.Old way of manipulating Excel documents was just taking too much time and R allows us to manage large data sets very easily.
First we created some fairly basic scripts to test the idea, adding more math into each script. A result is a full library of written scripts to save you time. And this is exactly our idea, to simplify process of creating reports and graphs within seconds. Once you have R and R Studio installed you can take data from all your stations and export via UFO Orbit. This data bundle is then fed into R and analysed by your criteria. You can choose shower and year to filter your data further. With one script you can generate your full reports in just a few minutes. All reports can be exported in JPG or PDF formats.
So let’s have a look at all Edmond’s Perseid shower meteors. First we can see how many actual matches the network gets:
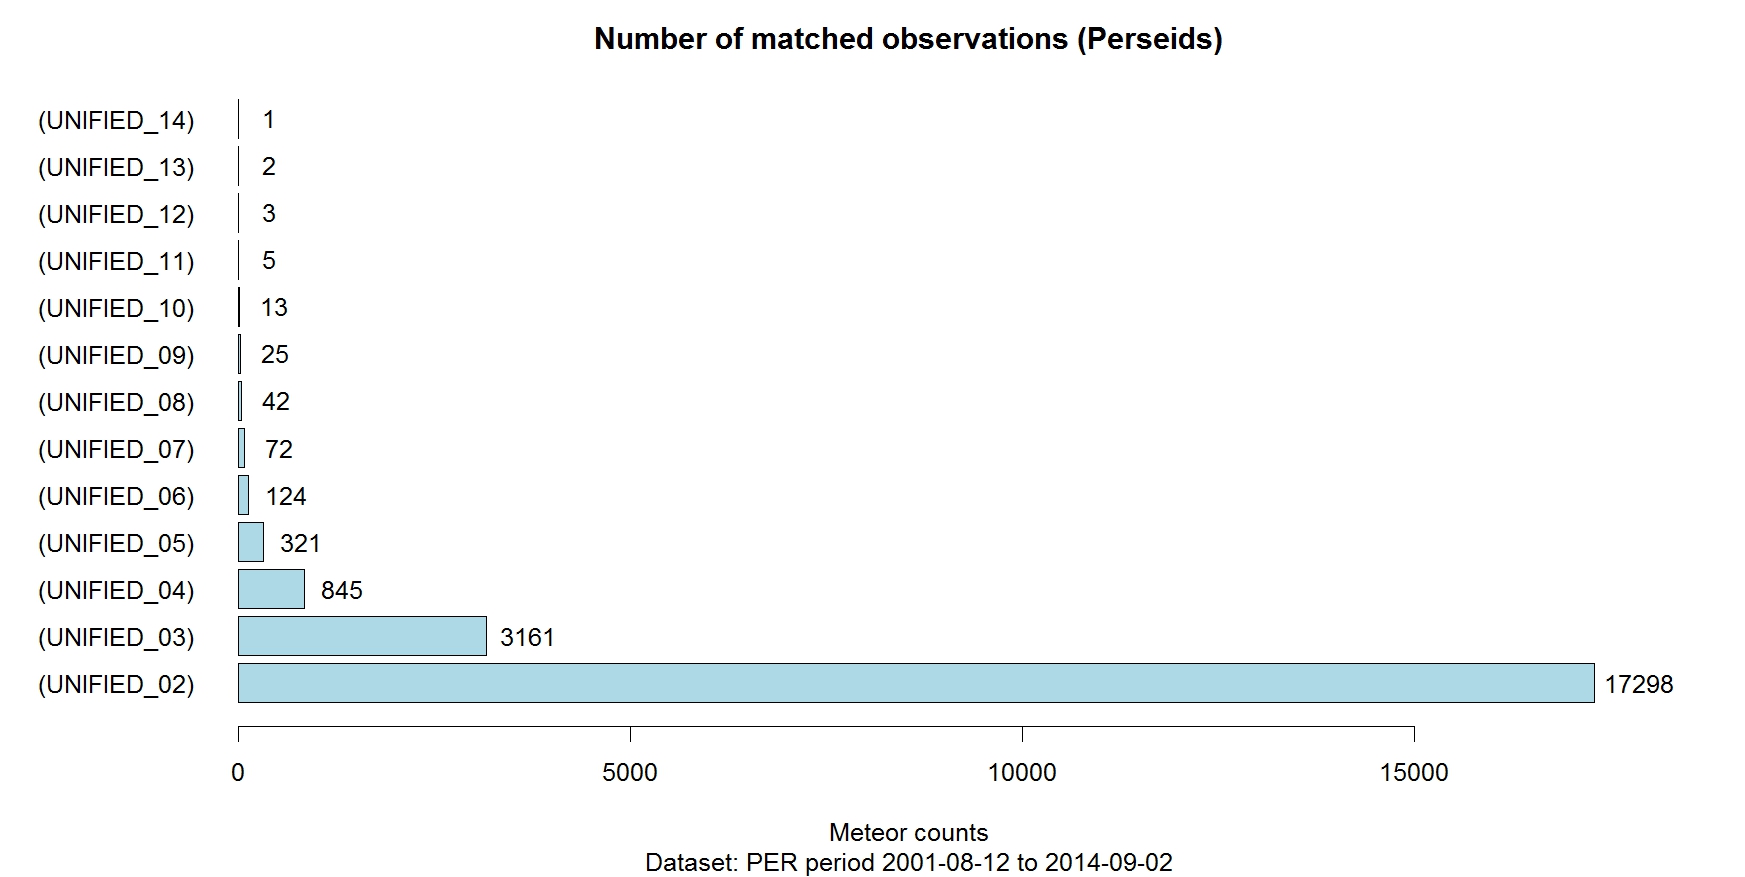
Image shows number of station that matched meteors. 2 station captures are most common with 17,298 matches but Edmond has up to 14 cameras matching the same meteors, an impressive result right there.
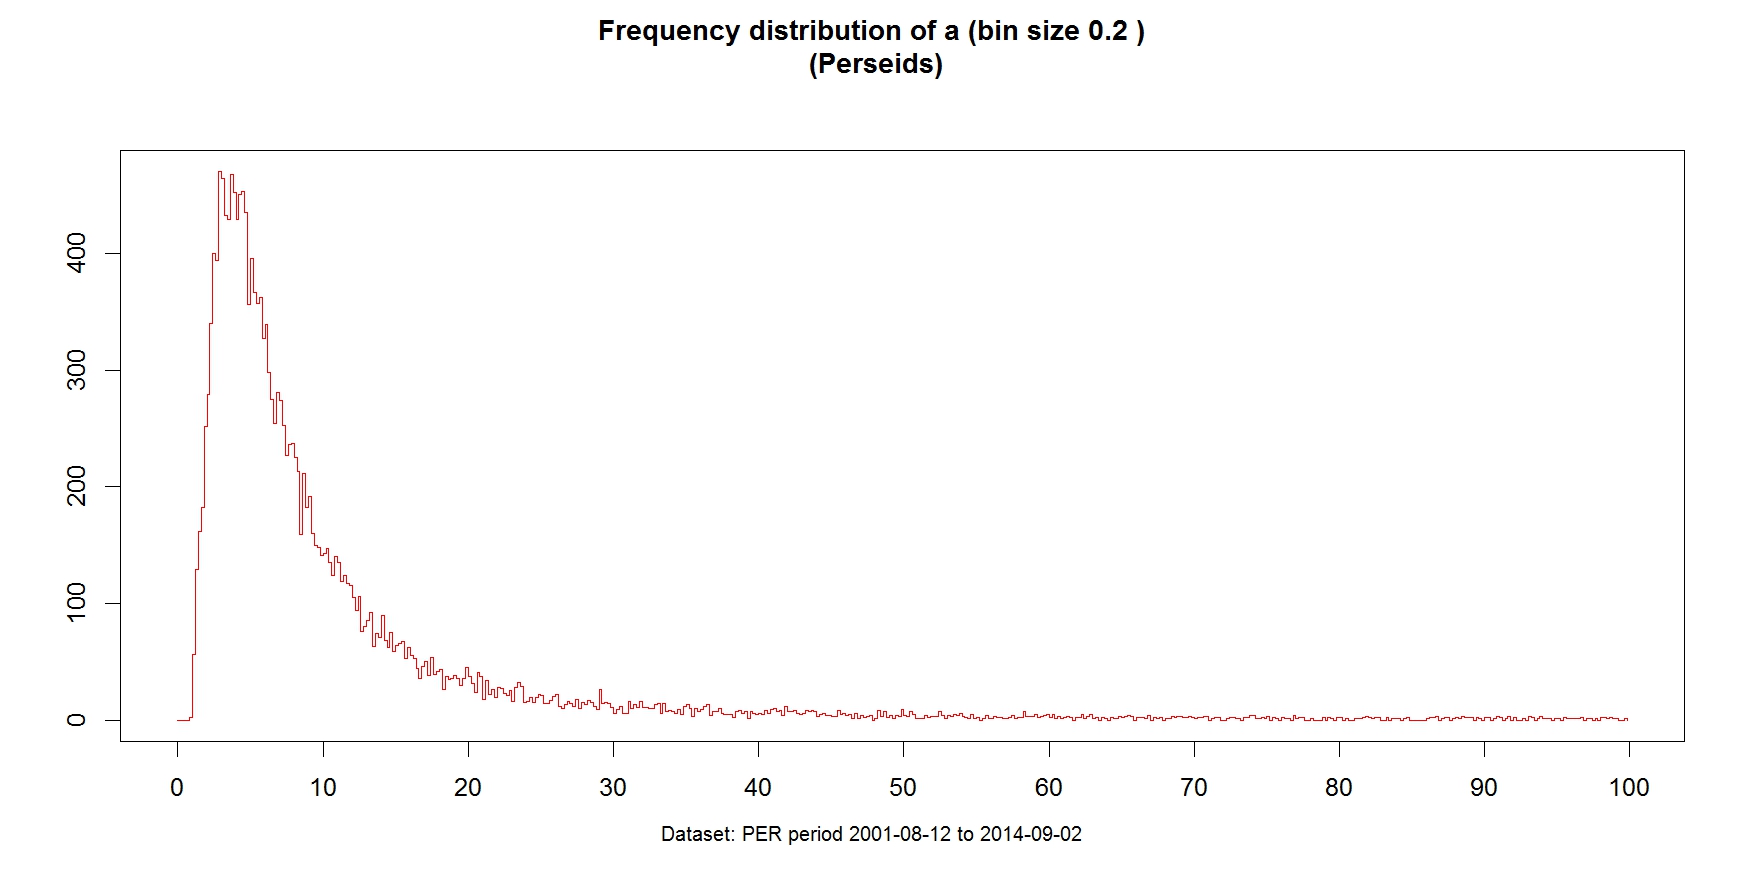
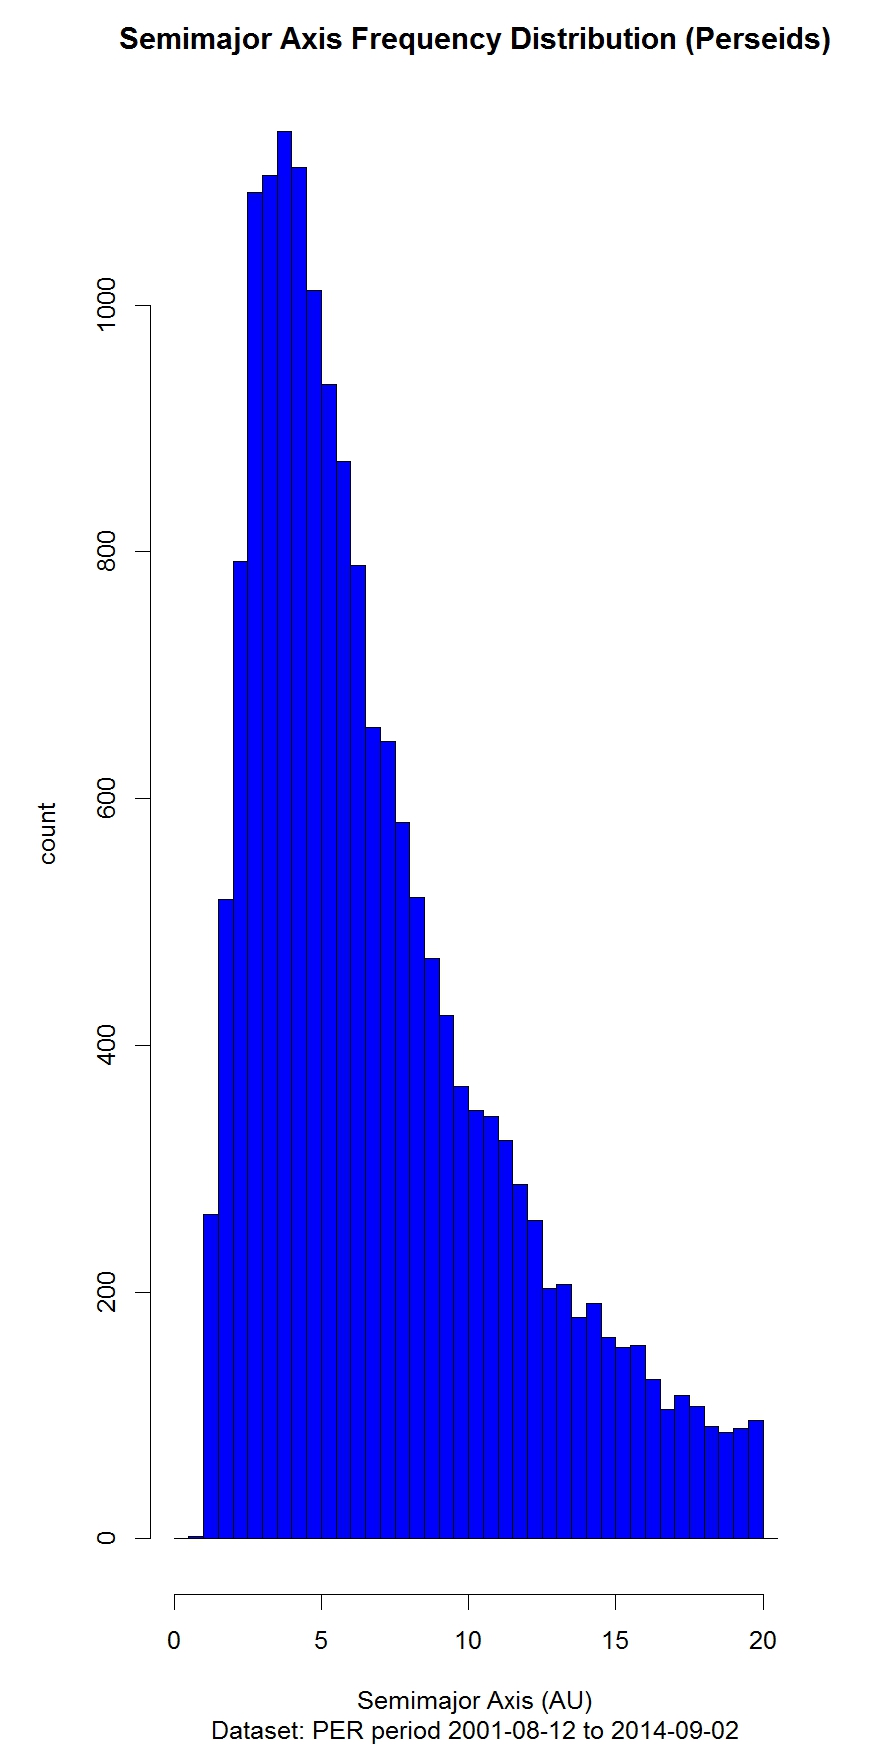
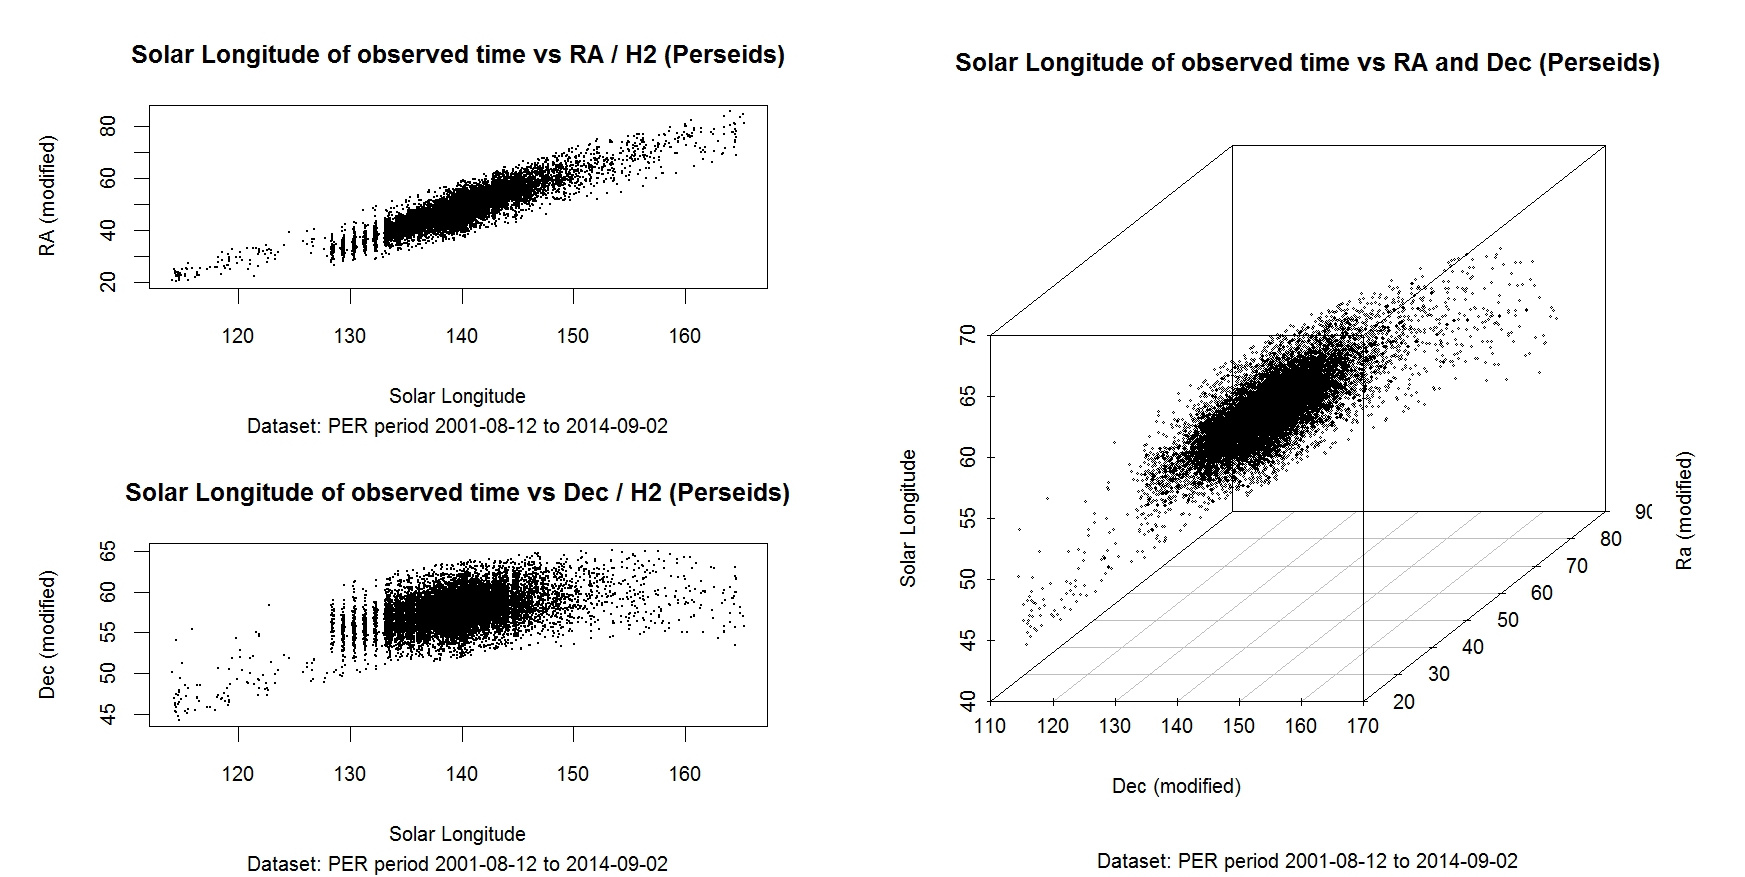
Further on we can generate some more graphs and analyse stream activity.

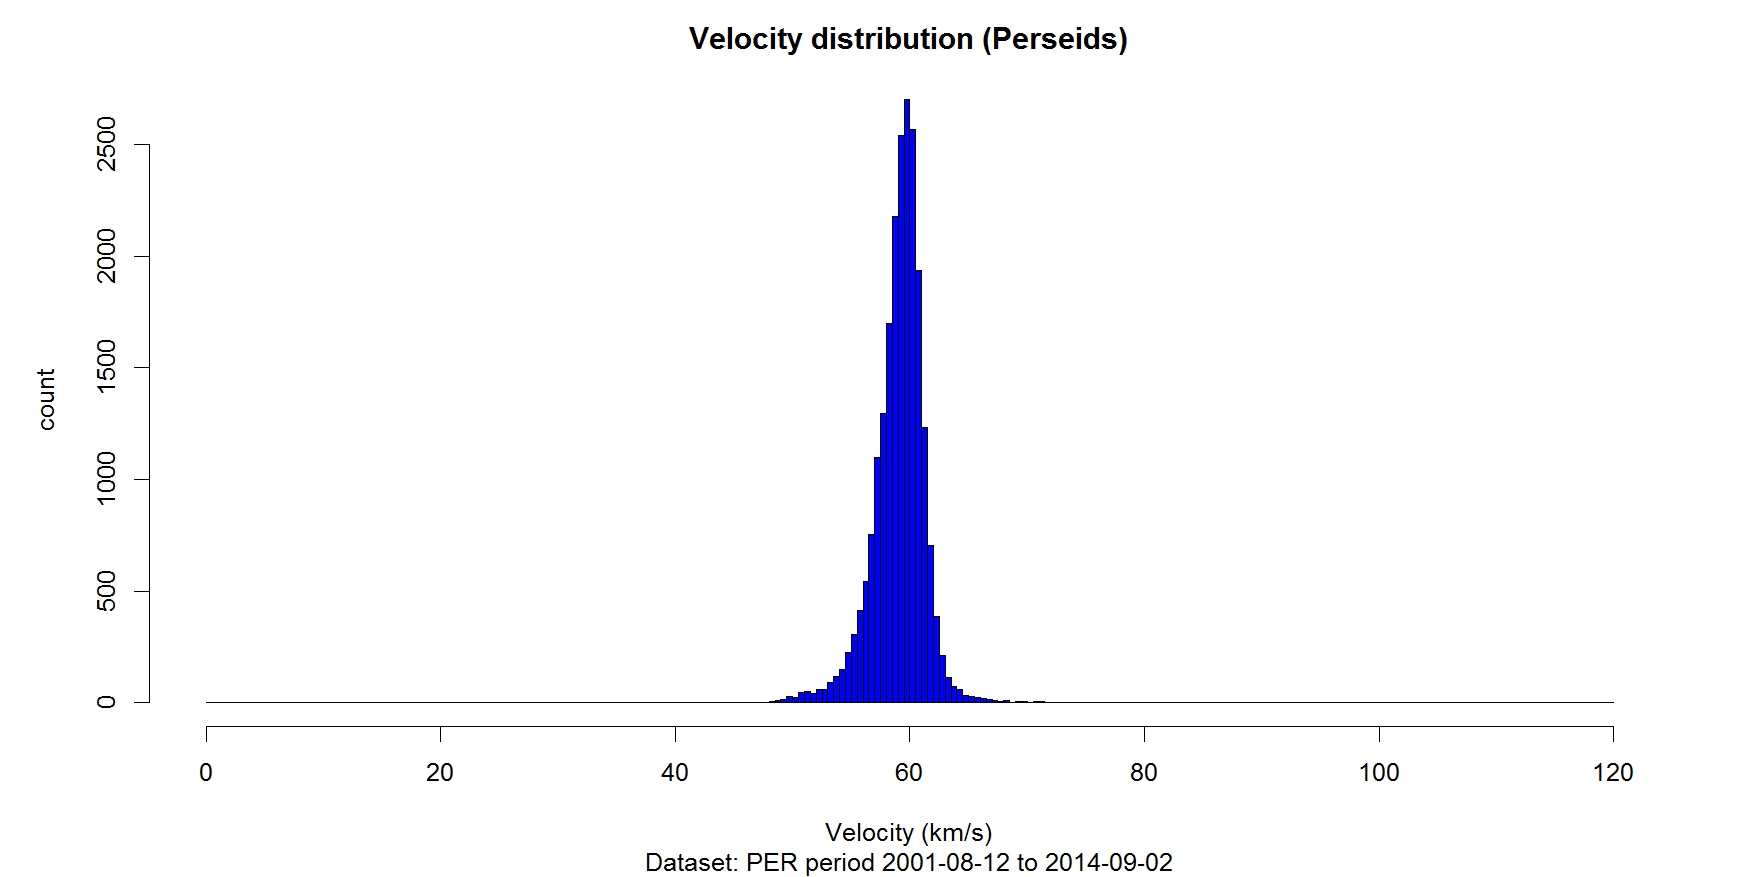
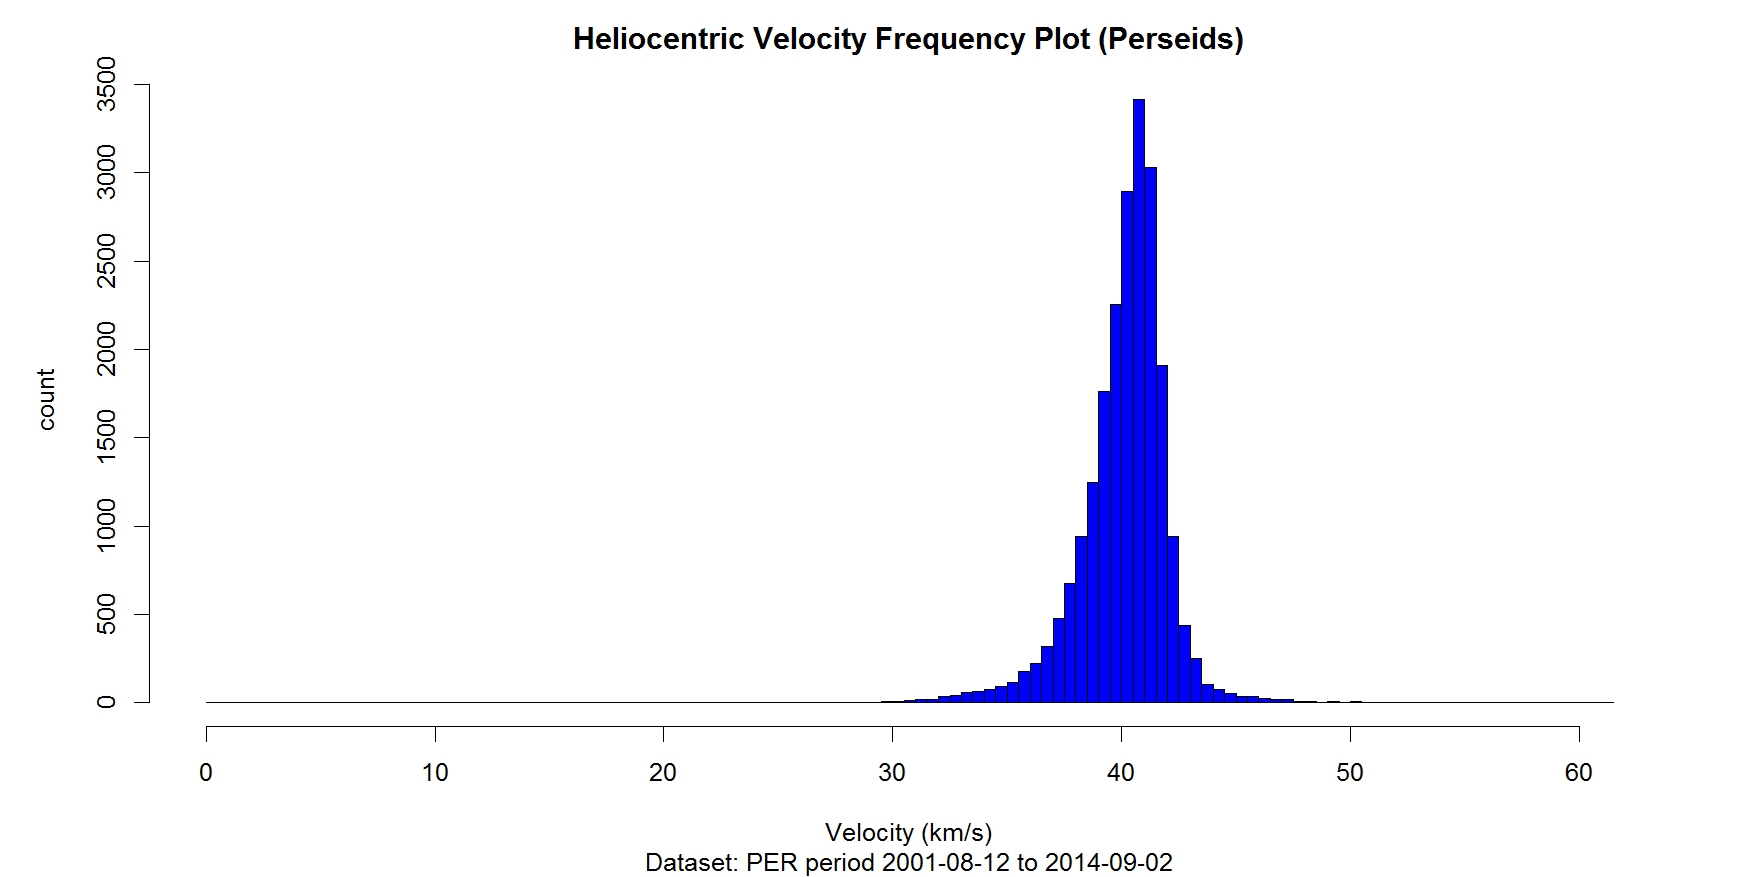
But we can do much more, let’s have a look at these velocity plots.
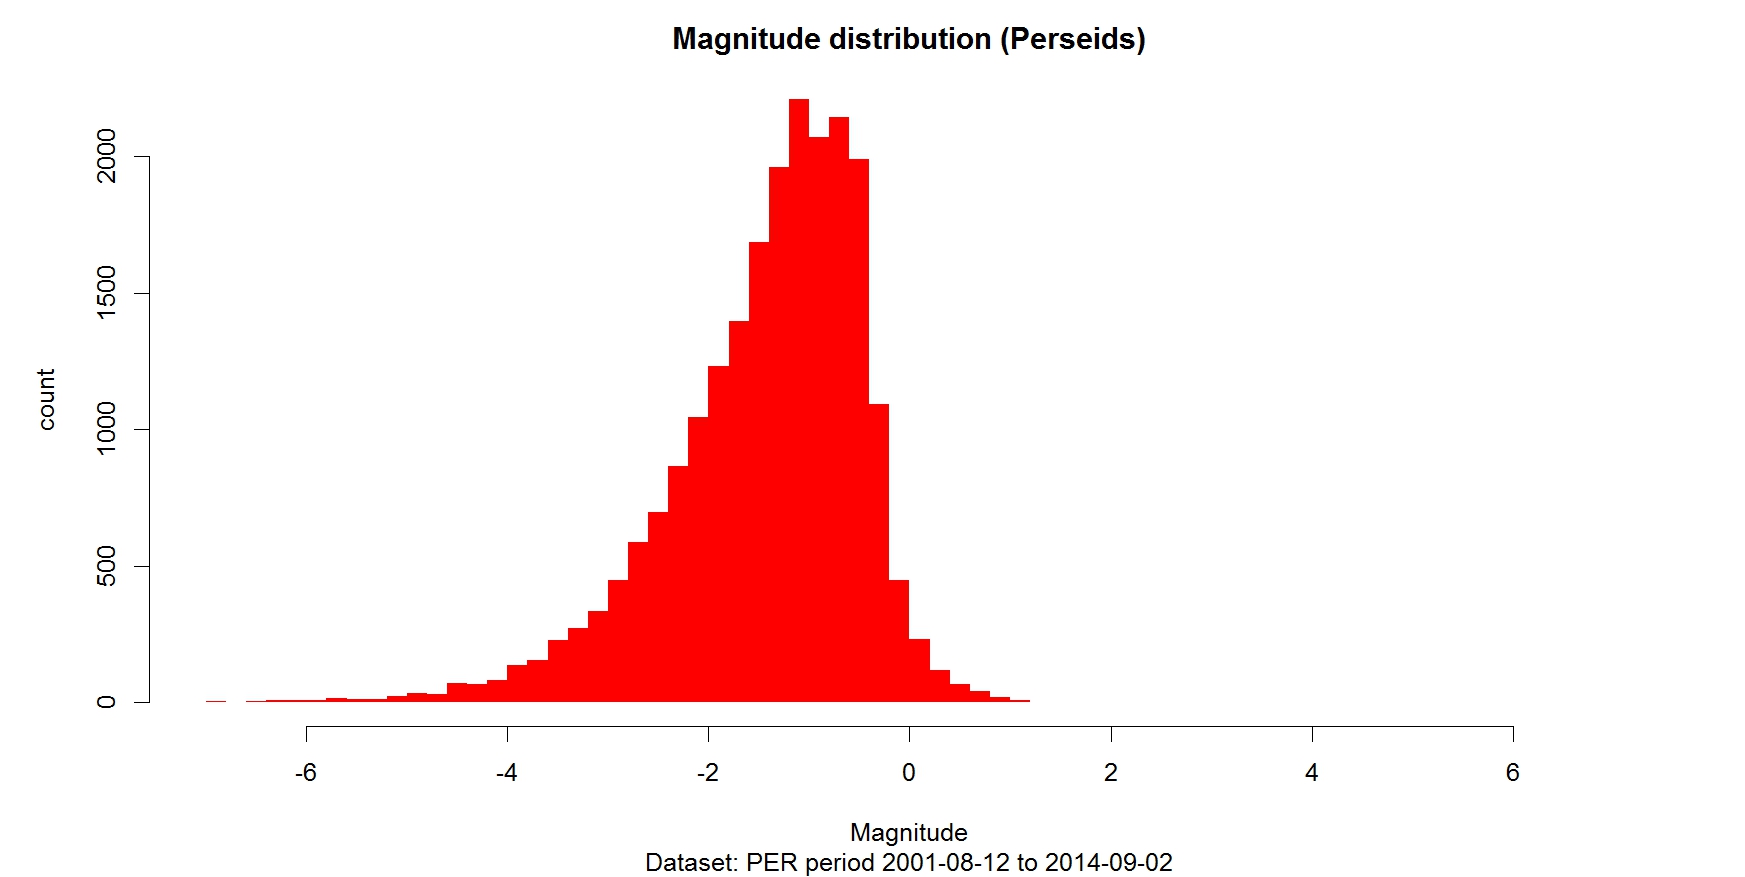
And we are just getting warmed up so let’s see what we can do with data that includes magnitudes.


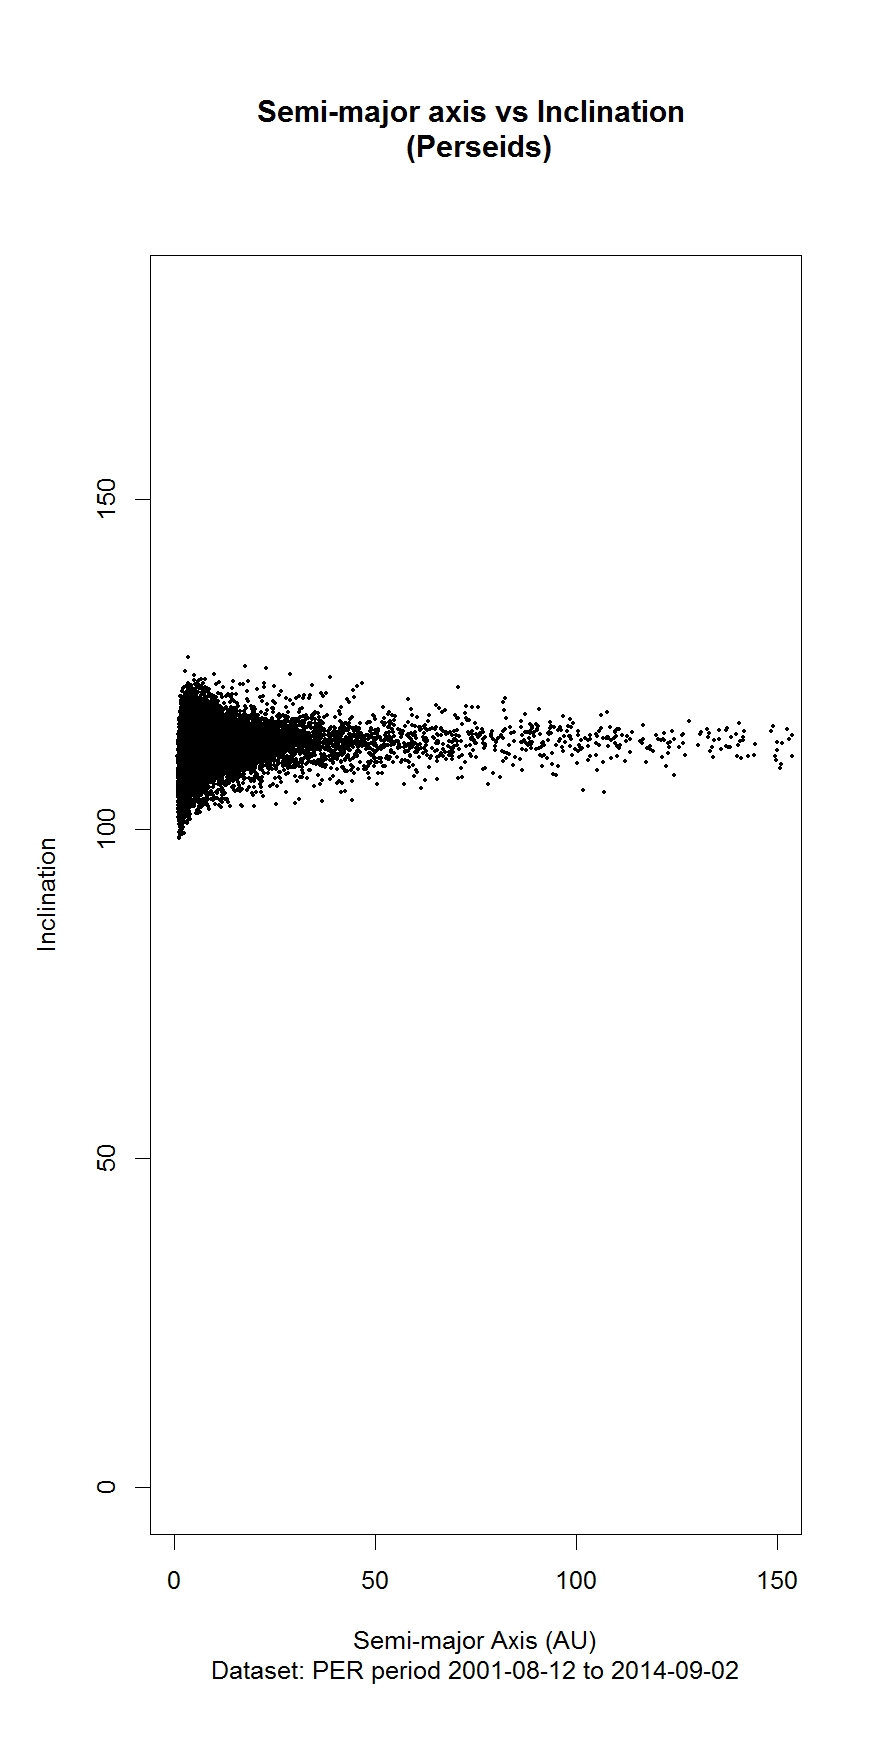
With R we don’t have to stop here.
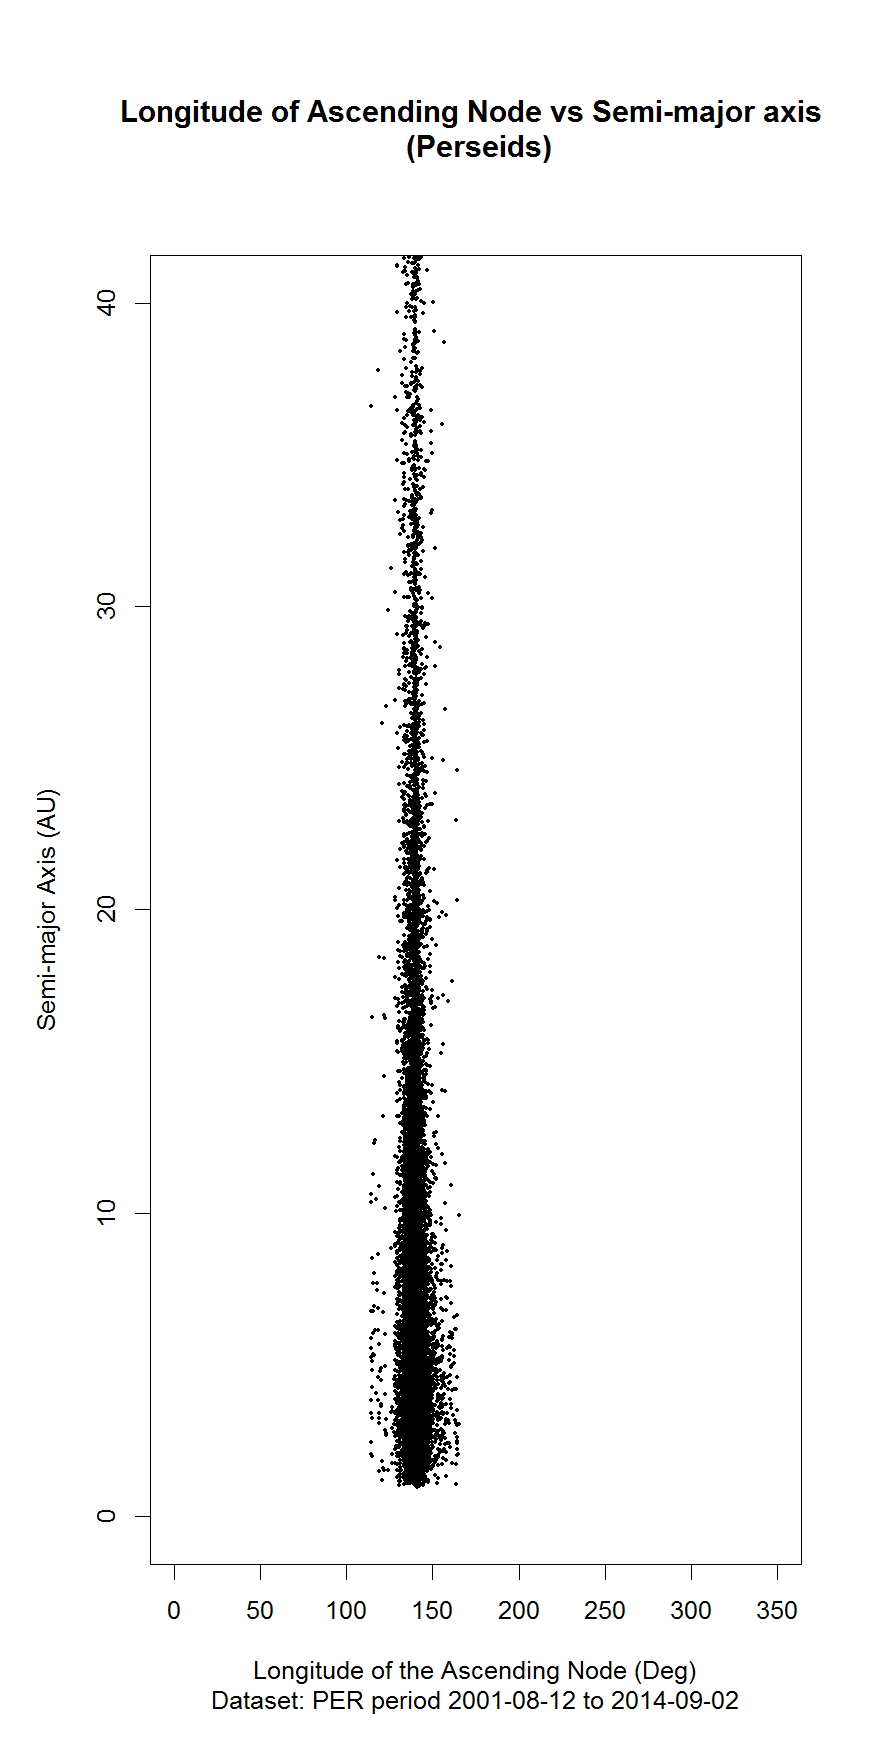
Yes there is a lot R can do. Especially considering the time it took to generate these reports. About 5 minutes. And this is the idea of our scripts, you can just add fresh data set and run the same script that will generate graphs for you.
If you would like to give it a go, you can download our full Suite for R.


