This article presents the results of statistical analysis of the EDMOND database. The growing amount of data in the database requires effective tool for analysis and data management. This instrument is a library of scripts in the R language, developed by members of UKMON. Scripts allow elimination of bad data and efficient statistical analysis of the database.
Introduction
R is a language and environment for statistical computing and graphics. It is a GNU project which is similar to the S language and environment which was developed at Bell Laboratories (formerly AT&T, now Lucent Technologies) by John Chambers and colleagues. R provides a wide variety of statistical (linear and nonlinear modelling, classical statistical tests, time-series analysis, classification, clustering, …) and graphical techniques, and is highly extensible. One of R’s strengths is the ease with which well-designed publication-quality plots can be produced, including mathematical symbols and formulae where needed. Great care has been taken over the defaults for the minor design choices in graphics, but the user retains full control. R is available as Free Software under the terms of the Free Software Foundation’s GNU General Public License in source code form. It compiles and runs on a wide variety of UNIX platforms and similar systems (including FreeBSD and Linux), Windows and MacOS.
Library of scripts for analysis
For the purpose of reduction and statistical analysis of the meteor database were developed amounts of scripts (Campbell-Burns et al., 2016) which use R language. Scripts allow the creation of statistical outputs in the form of graphs, such as tables. These outputs can be created for a global database (national, worldwide) and also for the individual stations. Huge benefit is a significant reduction in the time required for the creating of these outputs. Statistical analysis of the entire EDMOND database (Kornoš et al., 2014a) was performed globally as well as for the selected well-known (or very active) meteor showers (Table 1).
| Analysis type | Summary | Application |
| Simple counts | Meteor counts by solar longitude | EDMOND |
| Number of matched observation (UNIFIED_2, UNIFIED_3, etc) | EDMOND | |
| Magnitude | Count of stream meteors with magnitudes less than or equal to -4 (all streams) | EDMOND |
| Count of meteors with magnitudes less than or equal to -4 (by stream) | EDMOND | |
| Scatter plot of absolute magnitude (amag) against start height (H1) and amag against end height (H2) for individual meteors with a least squares line fit | meteor showers | |
| Frequency distribution of absolute magnitudes (amag) | EDMOND | |
| Orbital | Frequency distribution of semi-major axis (a) with a fixed (configurable) bin size | EDMOND, meteor showers |
| Length of observed trajectory in the Earth´s atmosphere | EDMOND | |
| Scatter plot of semi-major axis (a) vs ascending node (node) | EDMOND | |
| Scatter plot of semi-major axis (a) vs inclination (incl) | EDMOND | |
| Velocity | Frequency distribution of heliocentric velocity (vs) | EDMOND |
| Frequency distribution of geocentric velocities (vg) | EDMOND, meteor showers | |
|
Table 1: List of used scripts for the EDMOND database analysis, usage for complex or partial analysis is marked (EDMOND, meteor showers or both options). |
||
Description of the EDMOND database
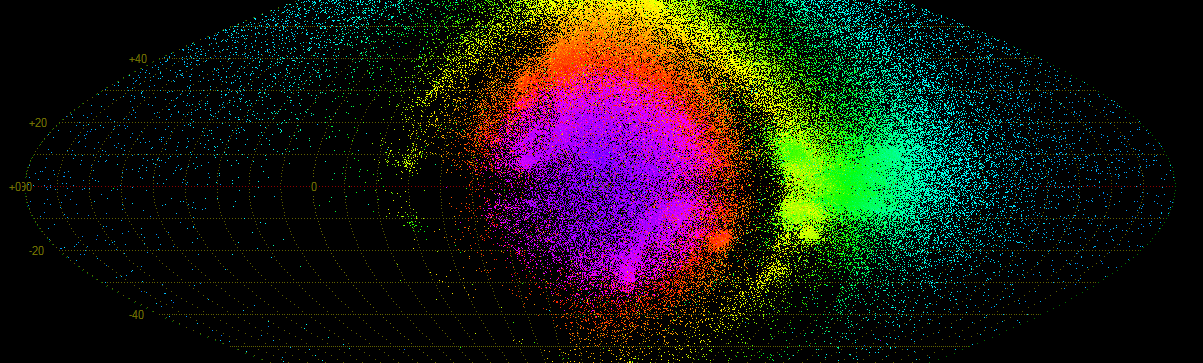
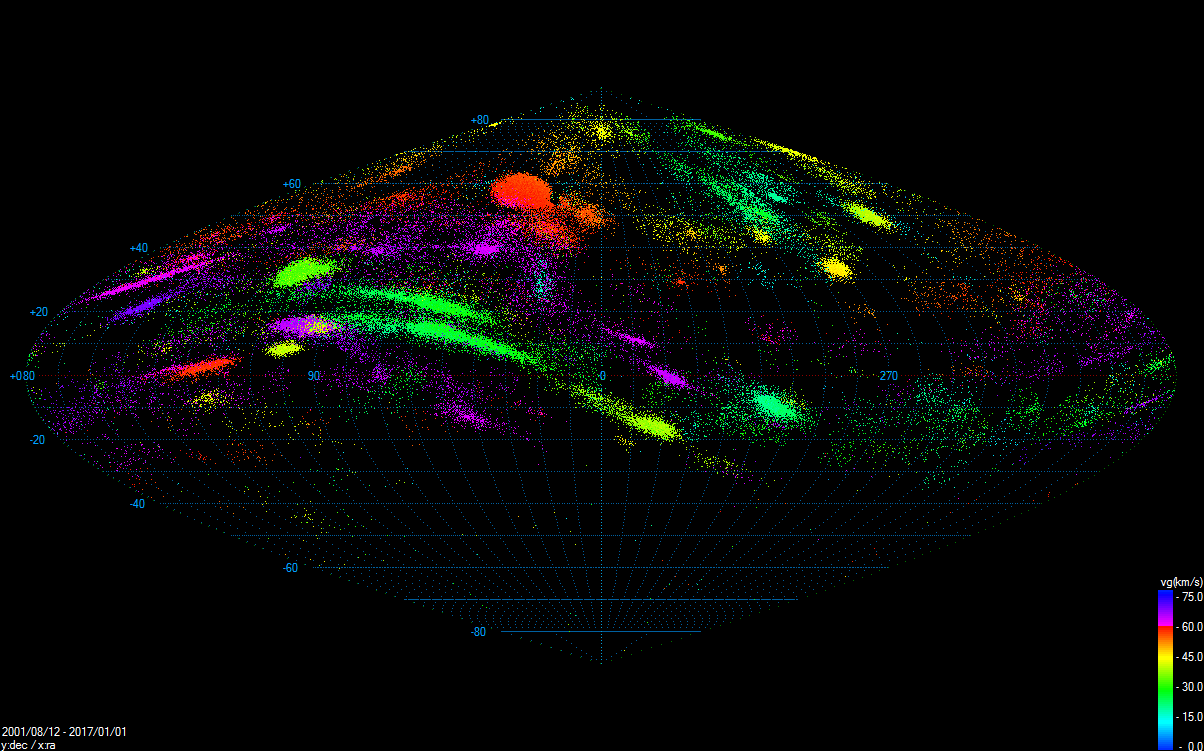
The European viDeo Meteor Observation Network (EDMONd) has been established only recently (Kornoš et al., 2014a,b). The network originates from spontaneous cooperation between observers in several parts of Europe. The EDMONd Network has been enlarged in recent years and at present consists of observers from 14 national networks and in the EDMOND database is implemented whole IMO VMN database which uses the MetRec detection software (Molau, 1999). Nowadays, due to the international cooperation, meteor activity is monitored over almost the entire Europe. Consequently, in recent years, multi-national networks of video meteor observers have contributed many new data. As a result, the latest version of EDMOND database (v5.03, April 2016) contains 3 833 098 single meteors and 252 425 orbits (Figure 1) collected from 2001 to 2015 (http://www.daa.fmph.uniba.sk/edmond).
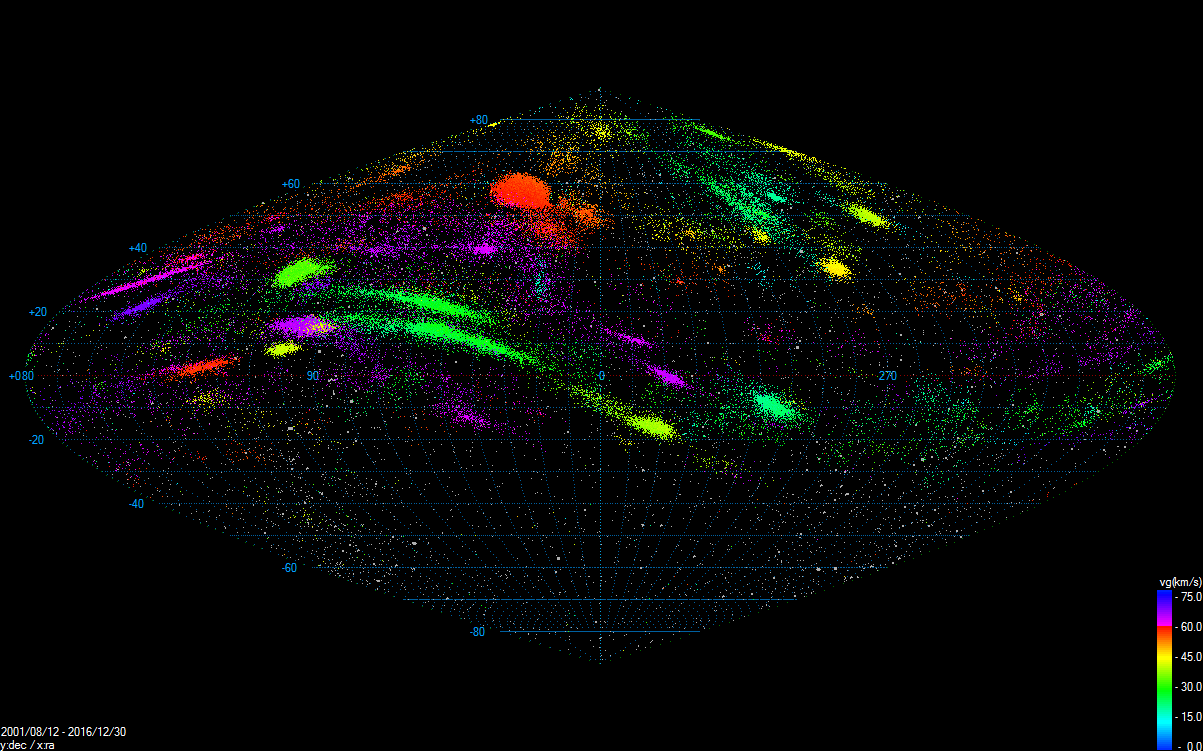
Figure 1: Radiants of all multi-station meteors belonging to the known meteor showers between years 2001 and 2015. Hammer projection in equatorial coordinates is used. Author: Jakub Koukal
Results – EDMOND database
The statistical analysis from the subgroup of scripts called „simple counts“ is focused on the layout of overall activity of meteor showers and sporadic background. The dependence of recorded multi-station orbits number on the solar longitude (Figure 2) shows the layout of meteor activity during the year and positions of strong meteor showers peaks. Significant peaks are evident around sollong of 32° (Lyrids/LYR), 140° (Perseids/PER), 208° (Orionids/ORI), 262° (Geminids/GEM) and 283° (Quadrantids/QUA). The activity of other well-known (or strong) meteor showers (e.g. Leonids/LEO or Taurids/NTA+STA) is not so markedly visible. This is caused by the irregular activity (Leonids) or long duration of activity and lower frequencies (Taurids). Graph of the stations number per one multi-station orbit (Figure 3) shows the layout of multi-station orbits recorded from the larger amount of stations. Approximately 75% of all multi-station orbits were recorded only from two stations, from three stations it is about 12% of the total number of multi-station orbits. Long (or bright) meteors are in many cases recorded from more than 10 stations, the maximum is the bolide recorded from 18 stations (20130817_011704).

Figure 2: Meteor counts by solar longitude (sollong). Author: Jakub Koukal
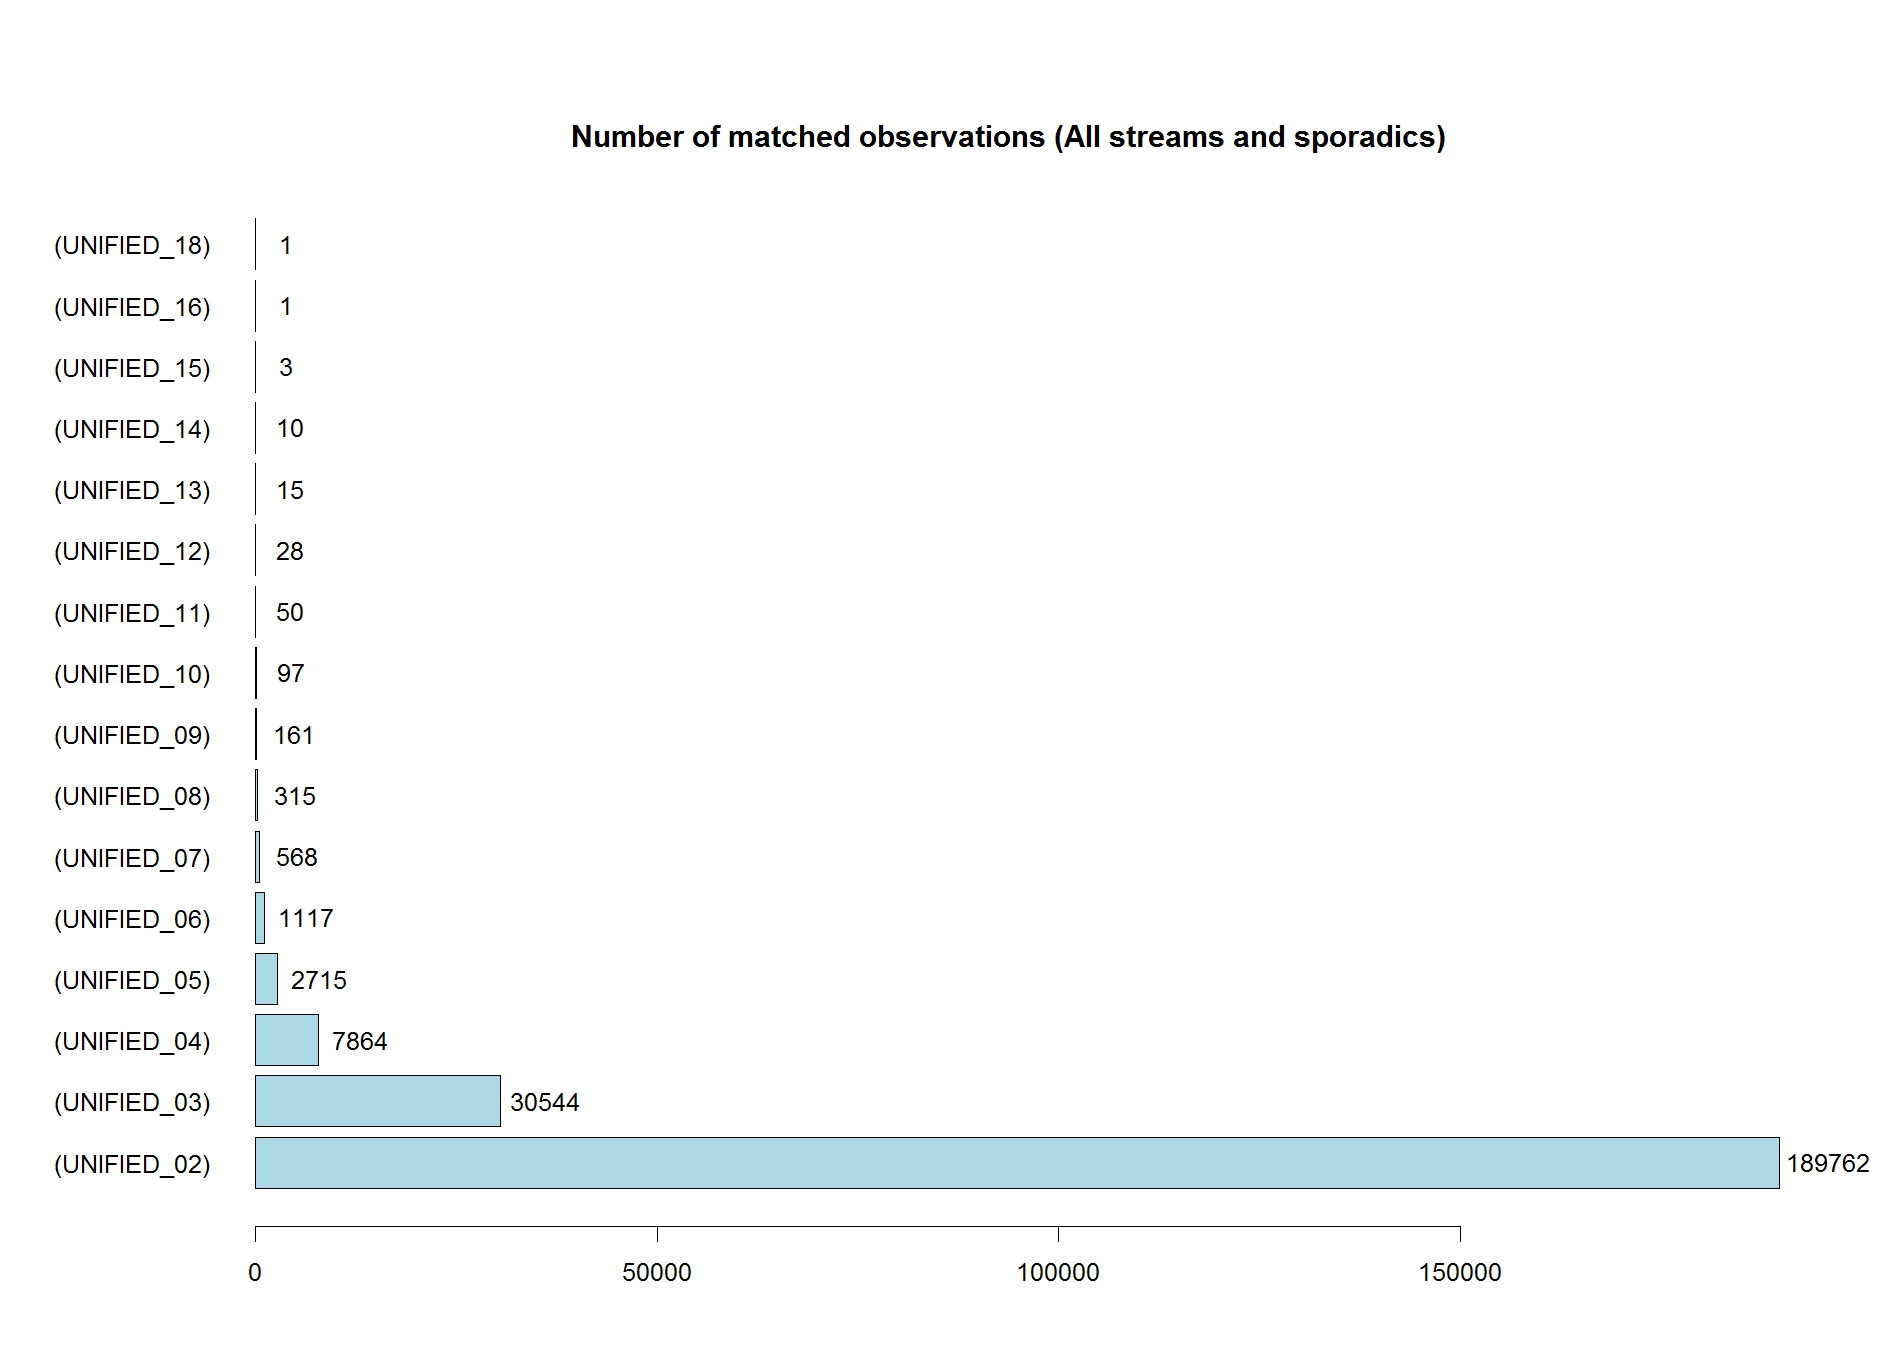
Figure 3: Graph of the stations number per one multi-station orbit. Author: Jakub Koukal
The statistical analysis from the subgroup of scripts called „magnitude“ is focused on the statistical analysis of recorded meteors absolute magnitude. Graph of the bolides number (amag less than or equal to -4) in the individual months during the year (Figure 4) shows the highest number of bolides in August. This is related to the Perseids swarm activity and activity of other meteor showers with high indicence of the bolides (α Capricornids/CAP, κ Cygnids/KCG, etc.). The other months with a high incidence of the bolides are October (Draconids/DRA), November (Leonids, Taurids) and December (Geminids). Graph of bolides divided into individual meteor showers (Figure 5) shows the contribution of individual meteors showers (and sporadic meteors) to the total number of observed bolides. The highest number of the bolides is in sporadic background, because sporadic meteors make up the bulk of observed orbits. The most of bolides within the meteor showers is produced by the following swarms: Perseids, southern Taurids (STA), Leonids, Geminids, Orionids, northern Taurids (NTA), Comae Berenicids (COM), Quadrantids and κ Cygnids. The histogram of absolute magnitude distribution (Figure 6) shows the overall layout of absolute magnitude of observed meteors (including sporadic background).
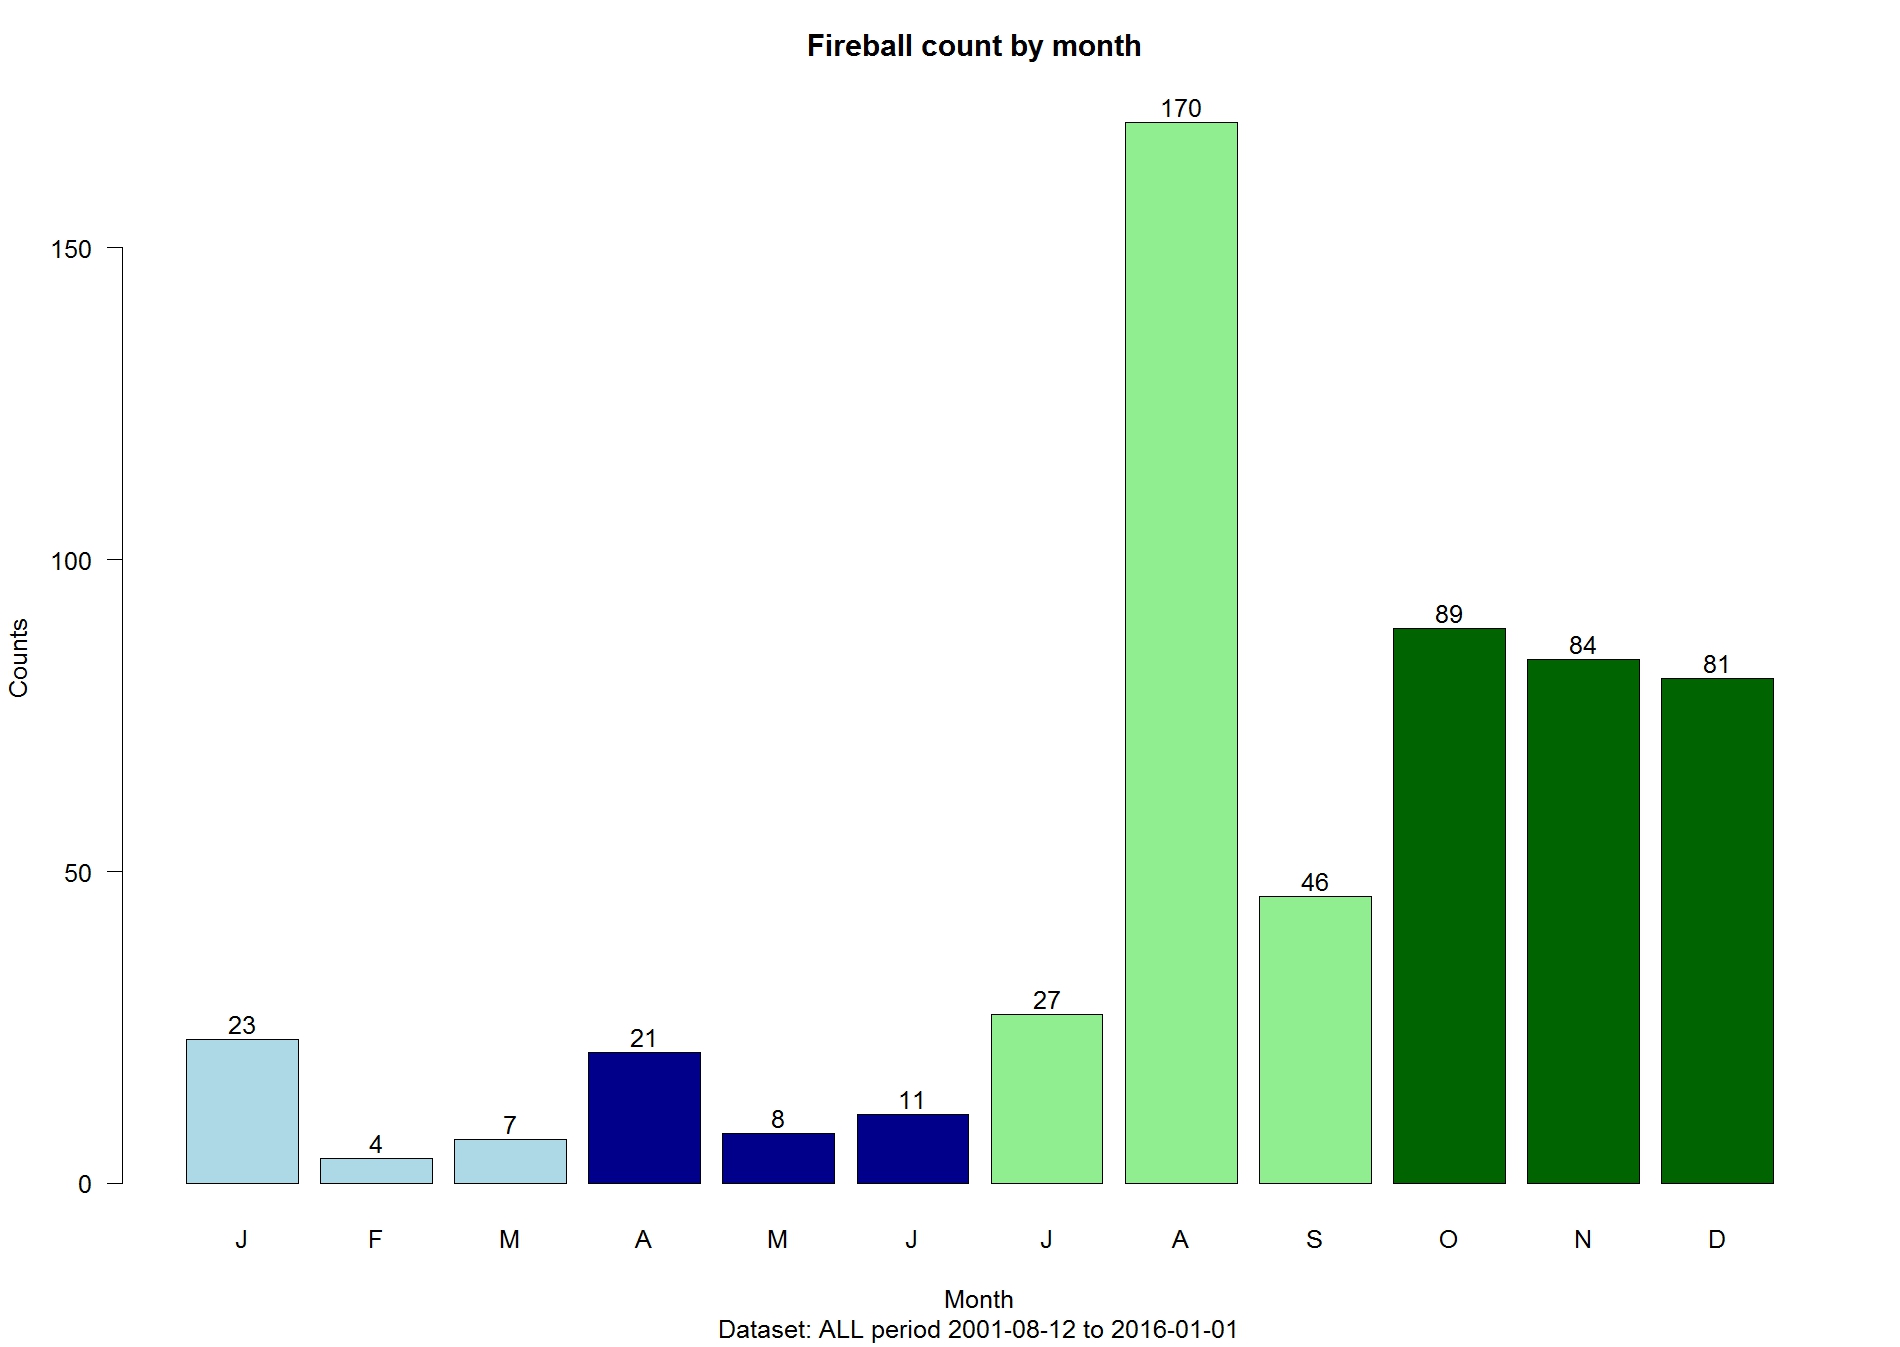
Figure 4: Count of stream meteors with magnitudes less than or equal to -4 (all streams). Author: Jakub Koukal
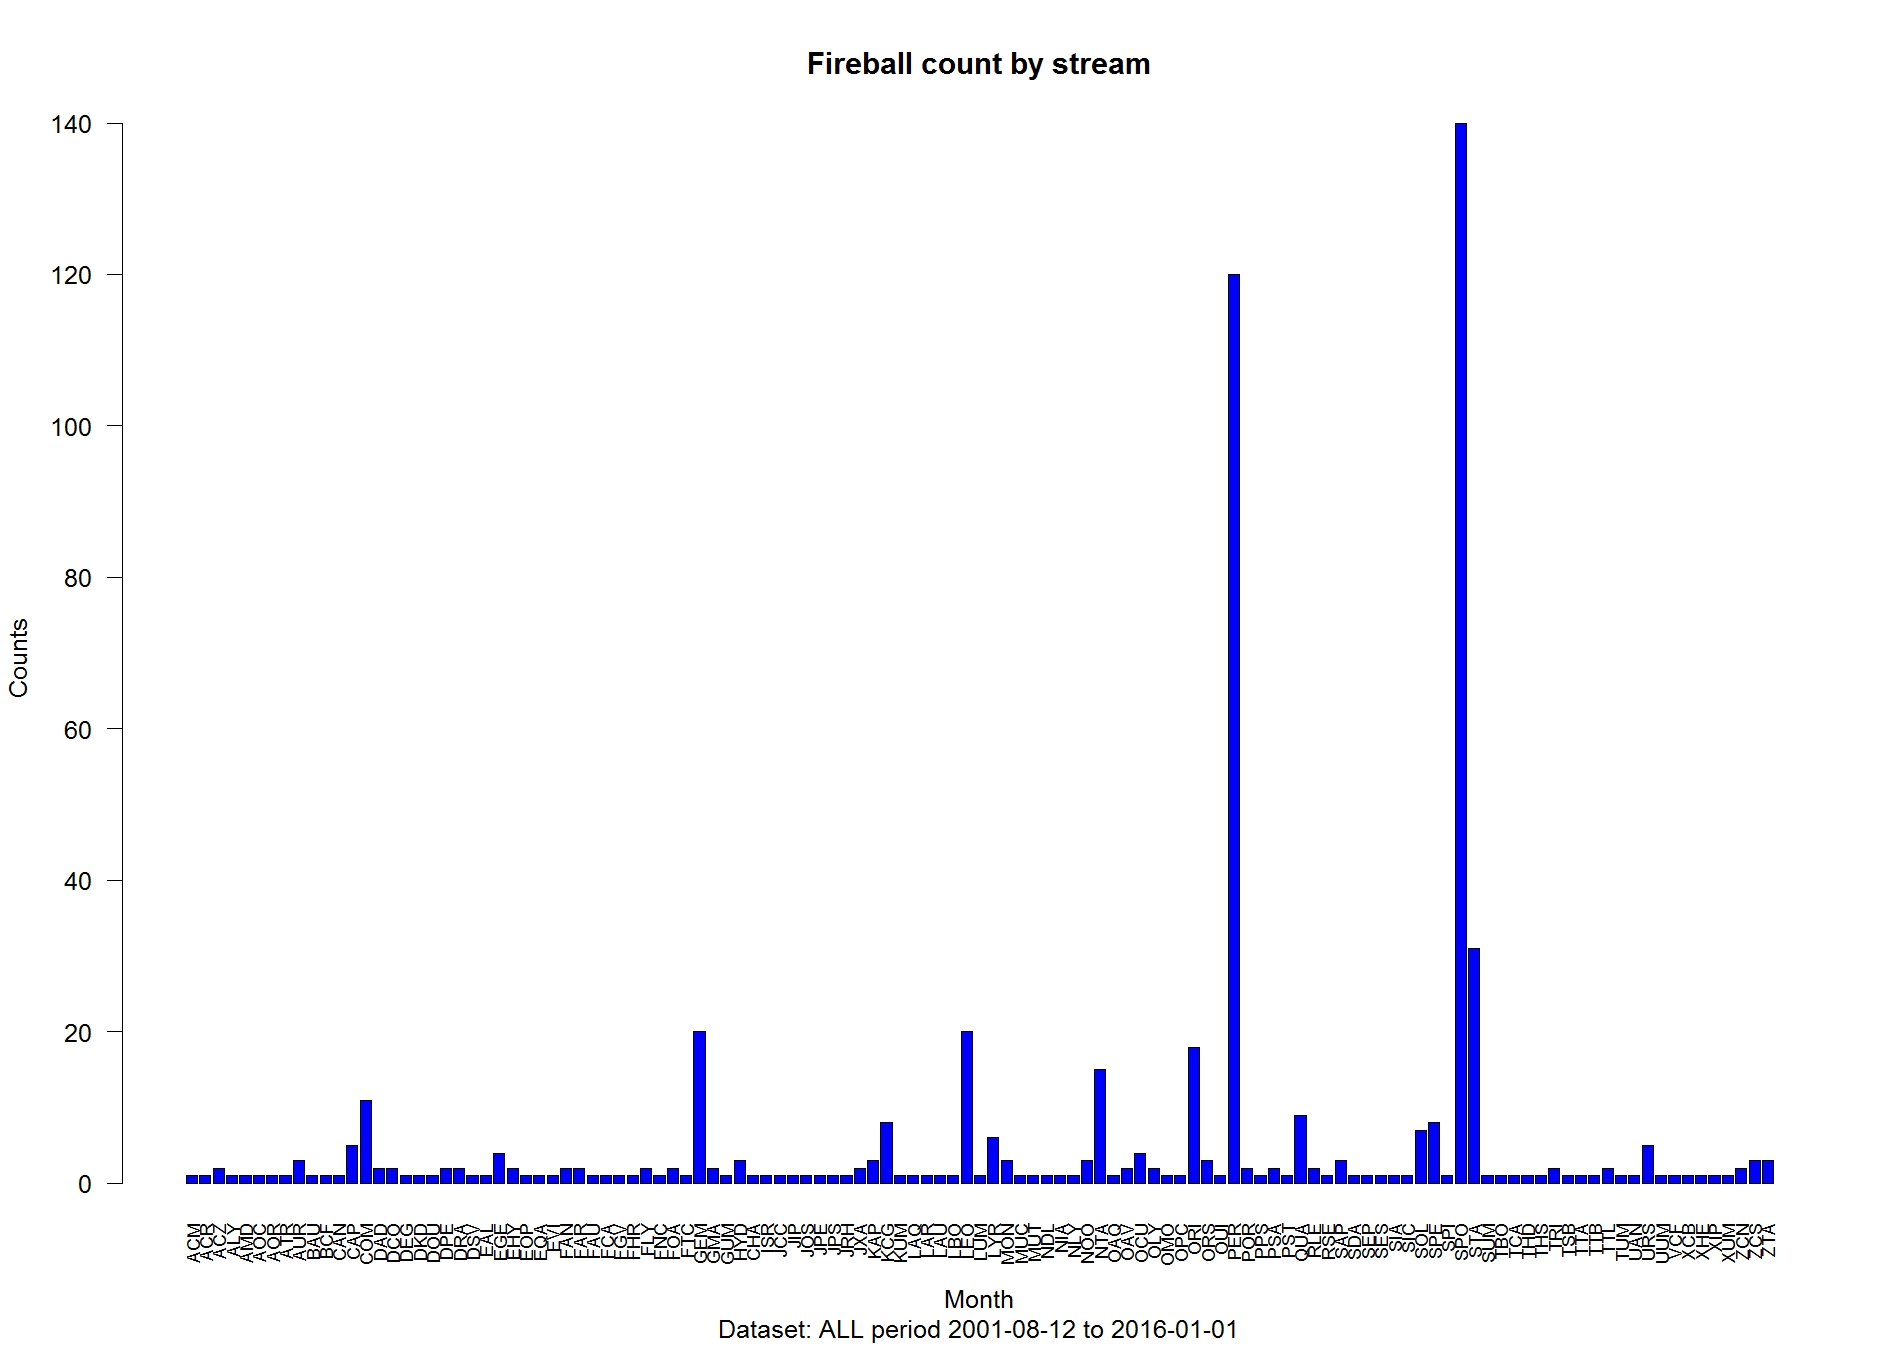
Figure 5: Count of meteors with magnitudes less than or equal to -4 (by stream). Author: Jakub Koukal

Figure 6: Frequency distribution of absolute magnitudes (amag). Author: Jakub Koukal
The statistical analysis from the subgroup of scripts called „orbital“ is focused on the analysis of the orbital elements of observed meteor orbits. The histogram of the semi-major axis distribution (Figure 7) shows that the major part of observed meteors has semi-major axis in the range of 1 to 6 AU. Significant peaks are in the range of 1.2 to 1.4 AU (e.g. Geminids) and also in the range of 2.0 to 2.4 AU (e.g. Taurids). In this range also orbits of meteors coming from the Antihelion source (meteor showers and sporadic background) with parent bodies in the main asteroid belt or in the Jupiter´s family comets. The graph of length of observed meteor trajectory in the Earth´s atmosphere (Figure 8) shows that typically is length of the trajectory between 10 and 20 km. The dependence of semi-major axis on length of the ascending node (Figure 9) shows mainly meteor showers with the long-period parent bodies. Clearly visible are especially Perseids, Lyrids, η Aquarids (ETA), Orionids, etc. The dependence of inclination on the semi-major axis (Figure 10) again shows long-period meteor showers clearly, e.g. Perseids, Lyrids, η Aquarids, Orionids, etc.
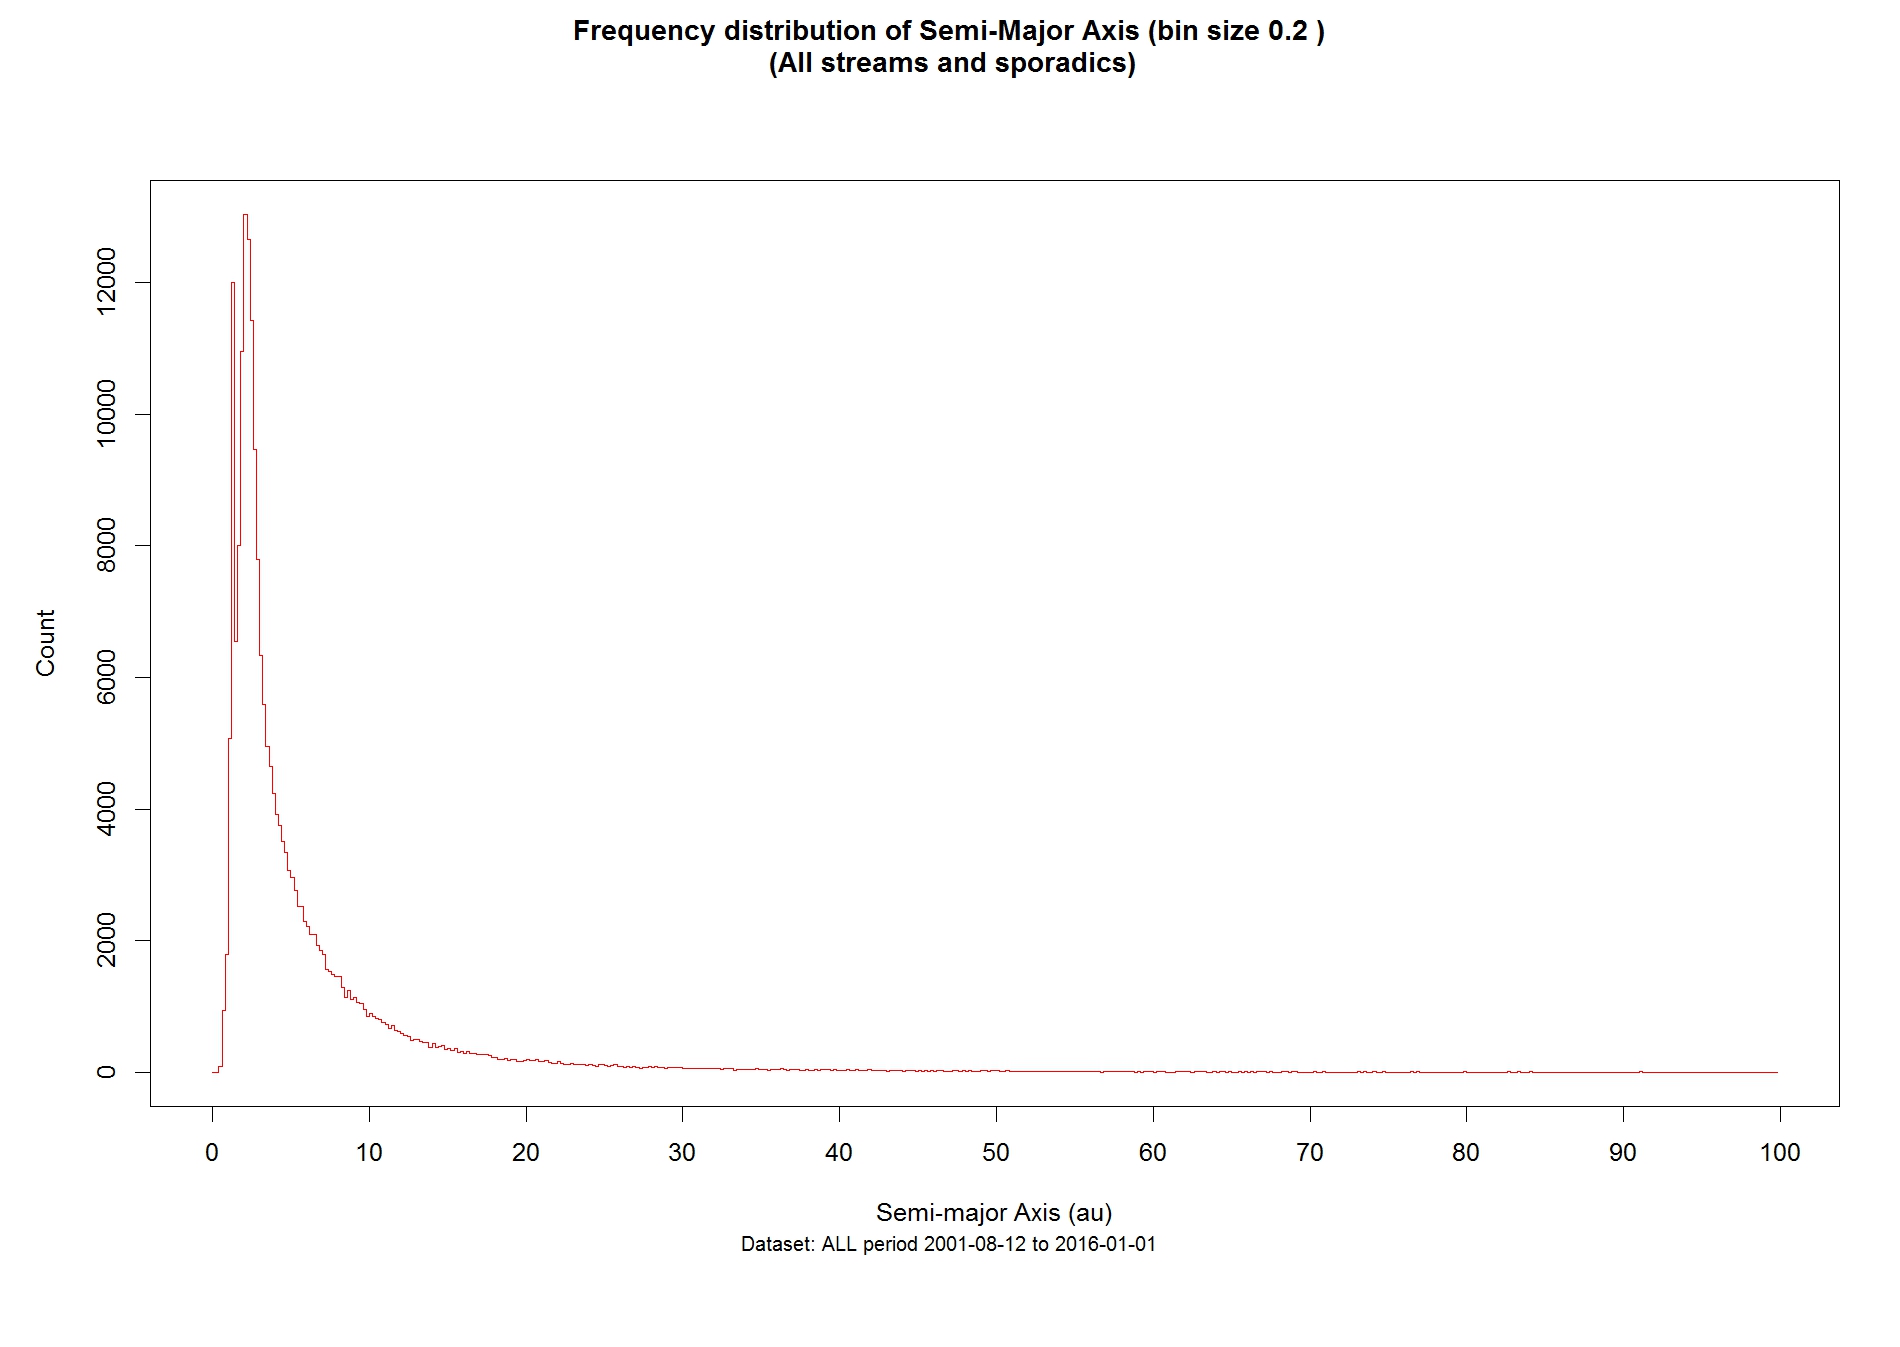
Figure 7: Frequency distribution of semi-major axis (a) with a fixed (configurable) bin size. Author: Jakub Koukal
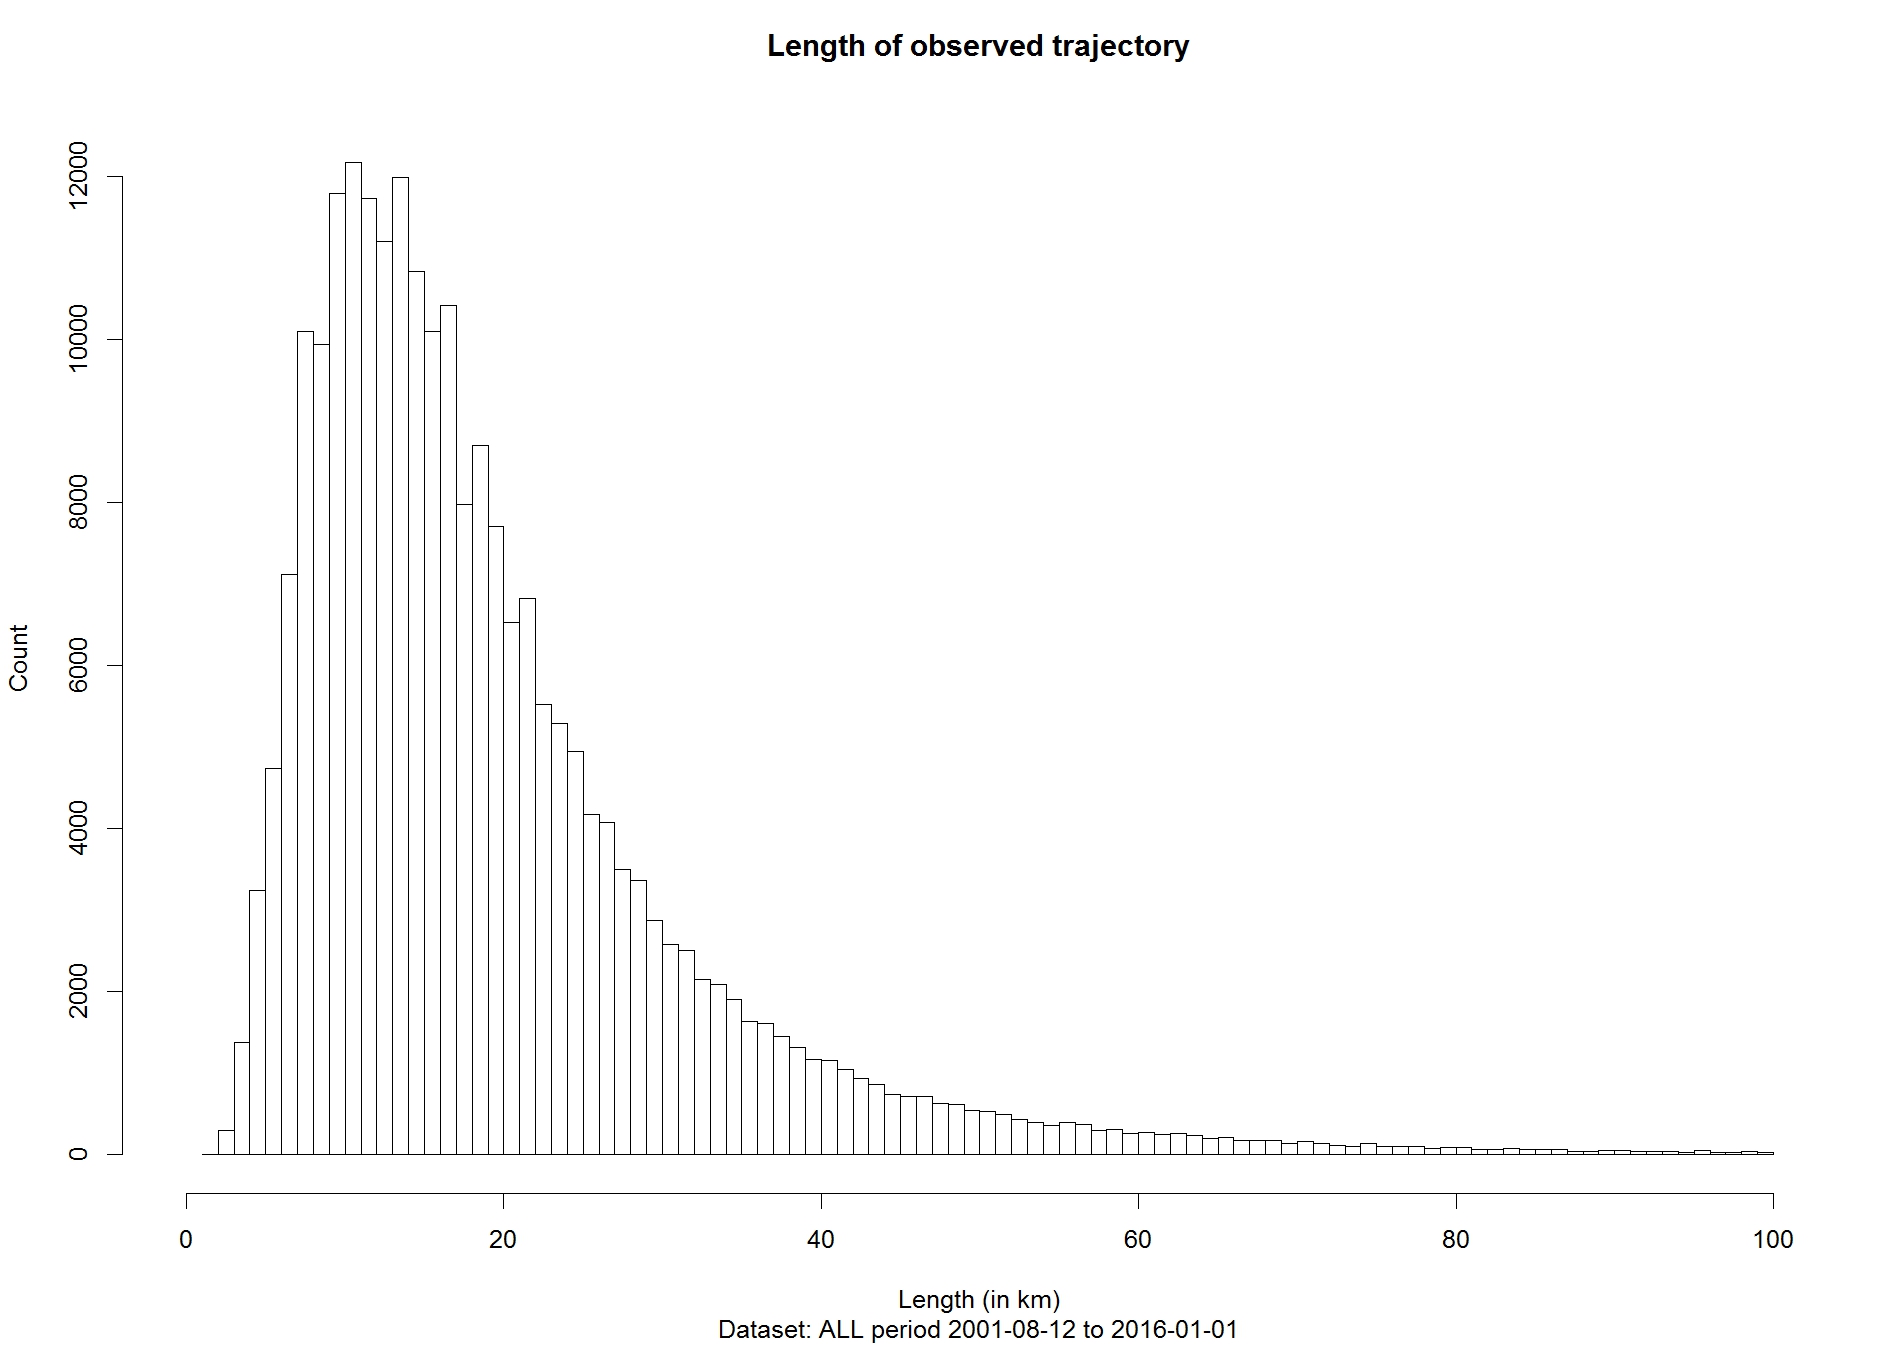
Figure 8: Length of observed trajectory in the Earth´s atmosphere. Author: Jakub Koukal
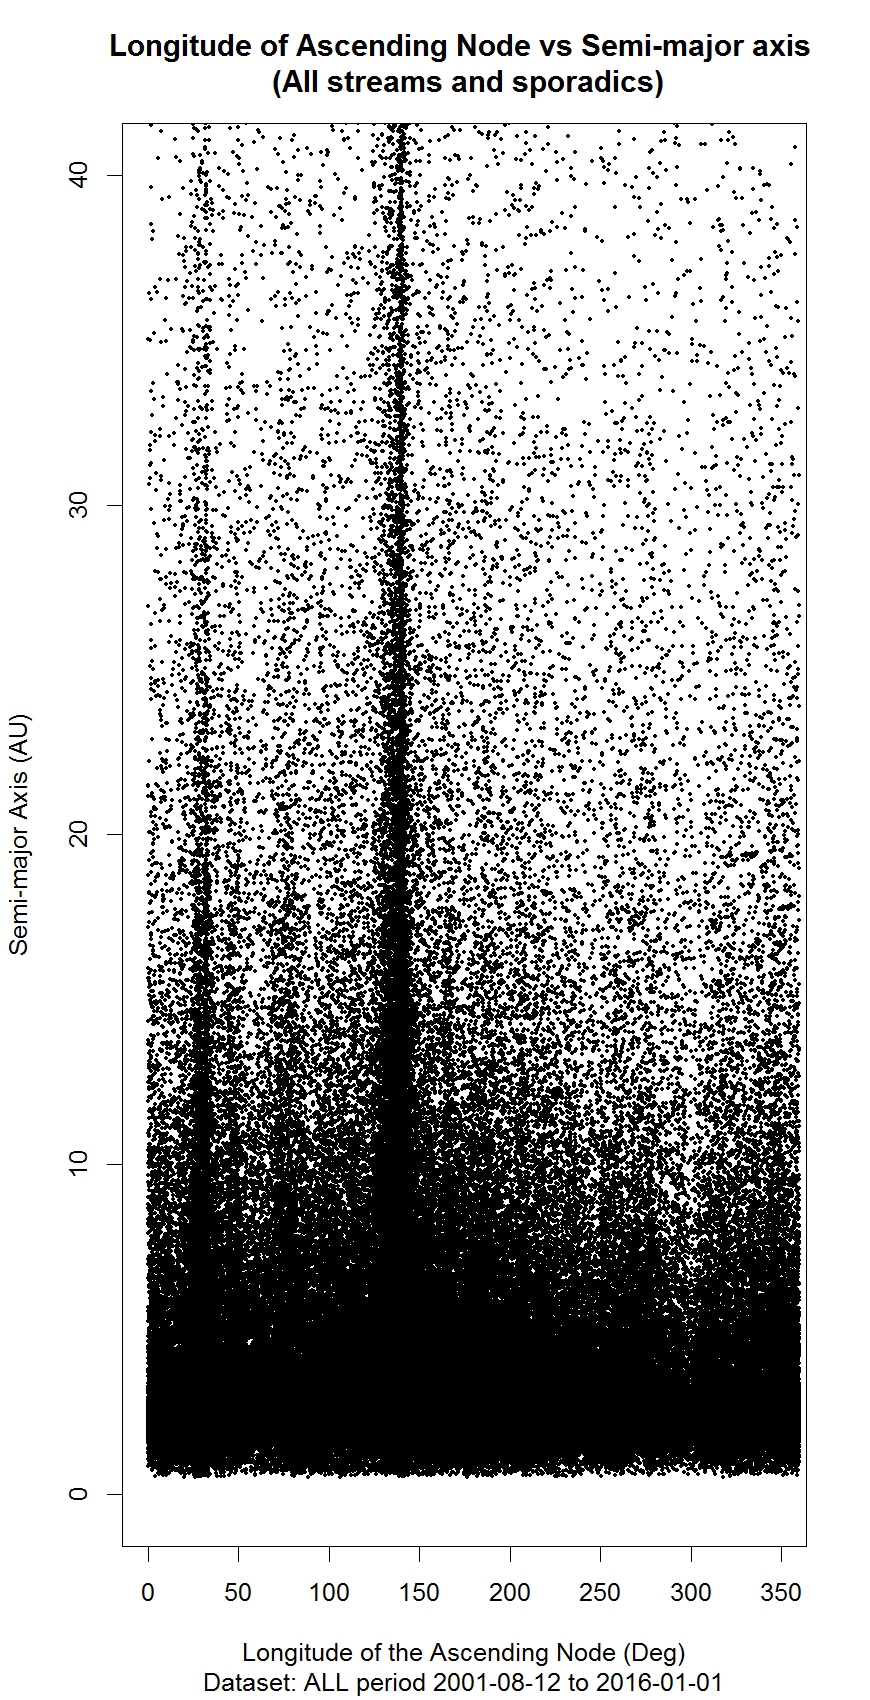
Figure 9: Scatter plot of semi-major axis (a) vs ascending node (node). Author: Jakub Koukal

Figure 10: Scatter plot of semi-major axis (a) vs inclination (incl). Author: Jakub Koukal
The statistical analysis from the subgroup of scripts called „velocity“ shows the histogram of heliocentric (Figure 11) and geocentric (Figure 12) velocity of meteors in the EDMOND database, including sporadic background. Histogram of the heliocentric velocity shows all hyperbolic orbits (vh is higher than 42.14 km/s) and could show orbits of the interstellar meteors (vh is higher than 46.6 km/s). In fact, the hyperbolic orbits are only product of the measurement errors of the individual orbits. Some meteor showers (e.g. Perseids) have the heliocentric velocity very close to the hyperbolic limit.

Figure 11: Frequency distribution of heliocentric velocity (vs). Author: Jakub Koukal
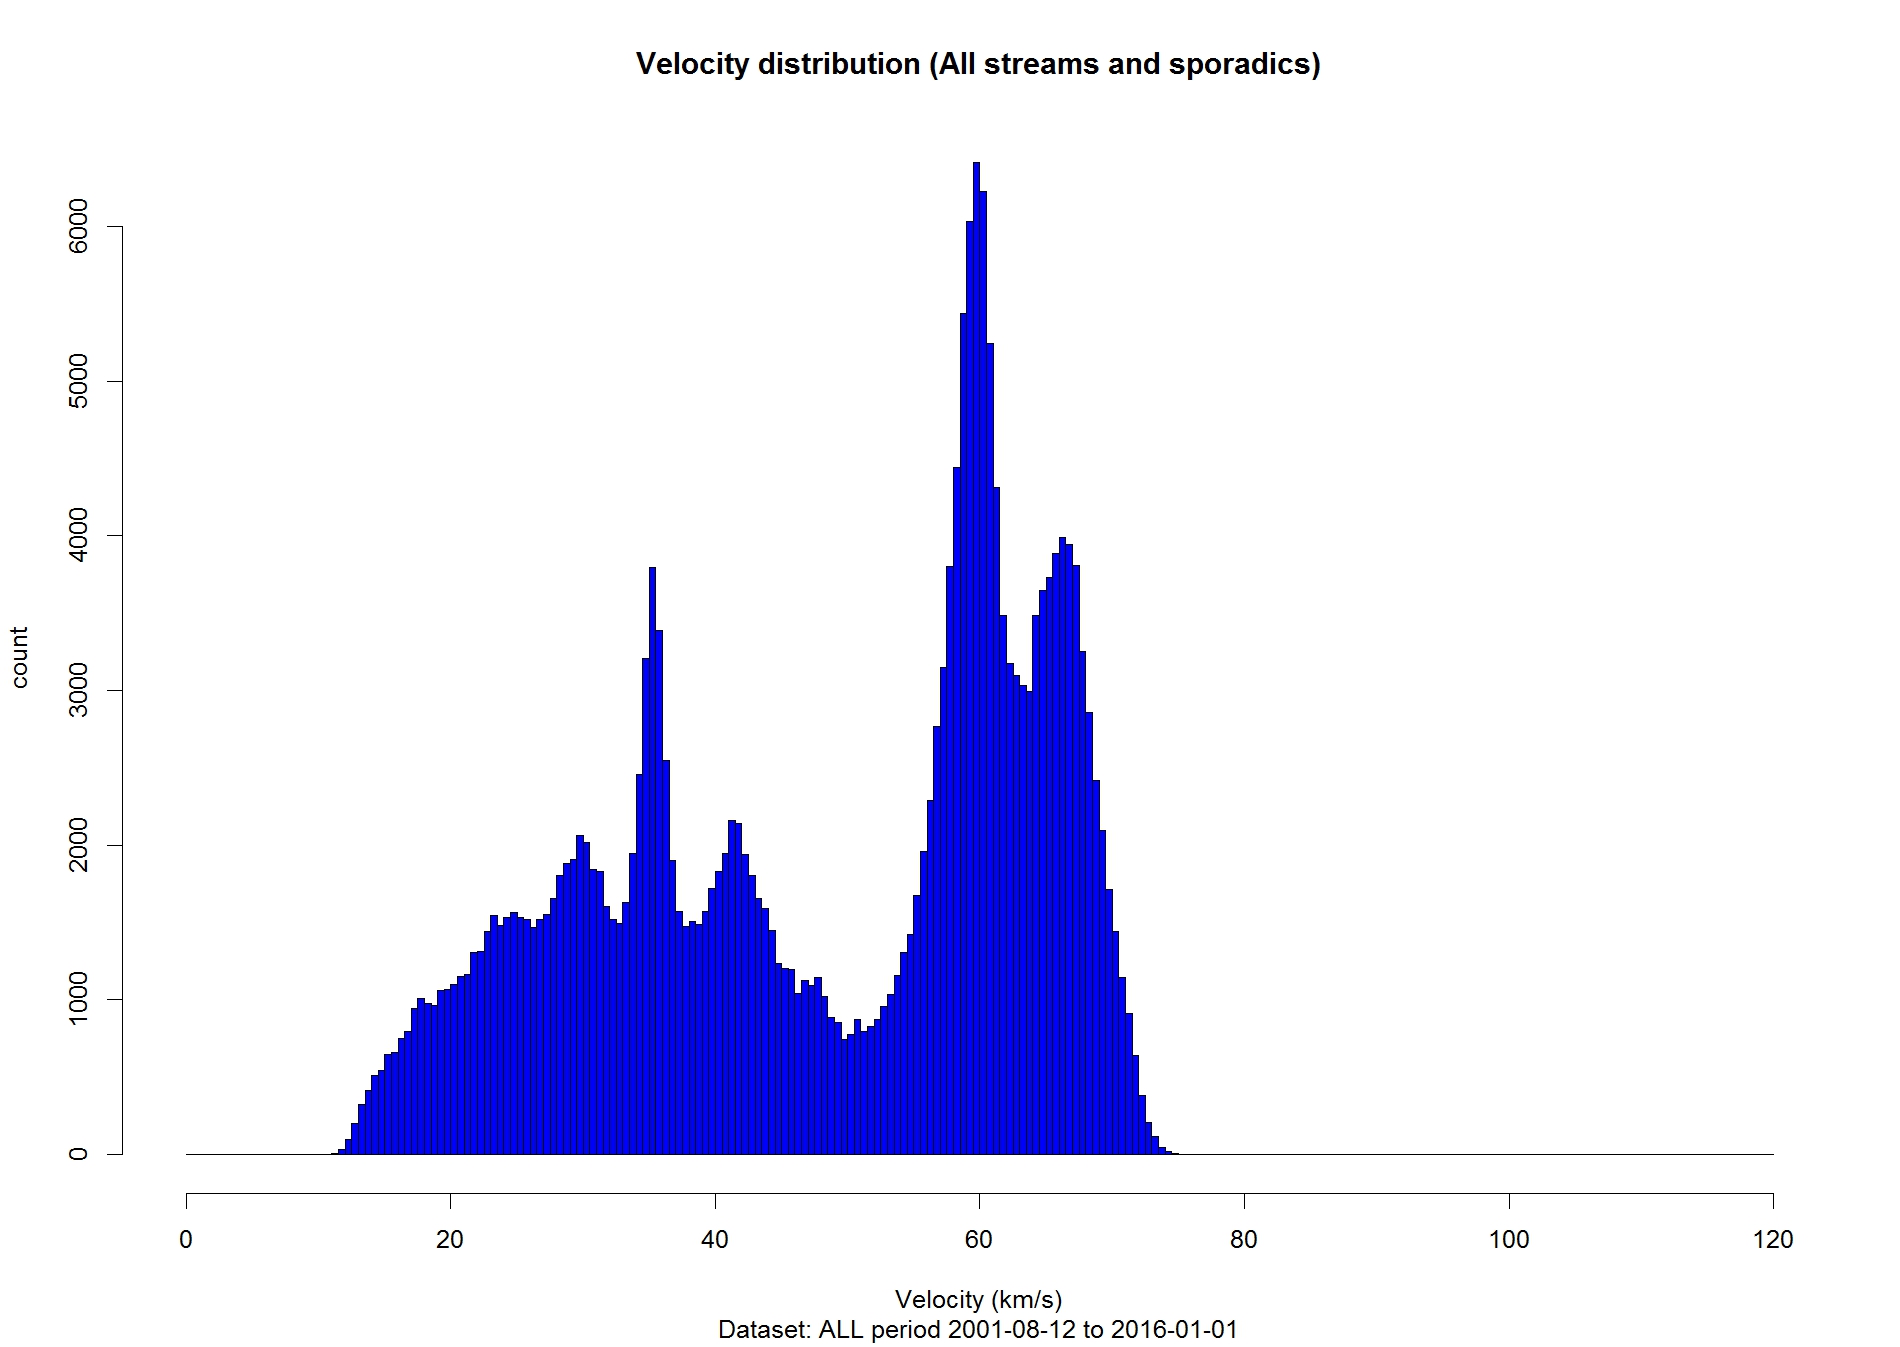
Figure 12: Frequency distribution of geocentric velocities (vg). Author: Jakub Koukal
Results – meteor showers
Within the statistical analysis of each meteor showers were selected 8 representatives, mainly well-known or very active meteor showers. Have been selected following meteor showers: Perseids, Geminids, Orionids, northern Taurids, southern Taurids, Comae Berenicids, Lyrids and Quadrantids. For the selected swarms was performed comparison of the semi-major axis histograms (Figure 13), the comparison of the dependence of start height and end height of the atmospheric trajectory on the absolute magnitude (Figure 14) and the comparison of the geocentric velocity histograms (Figure 15).
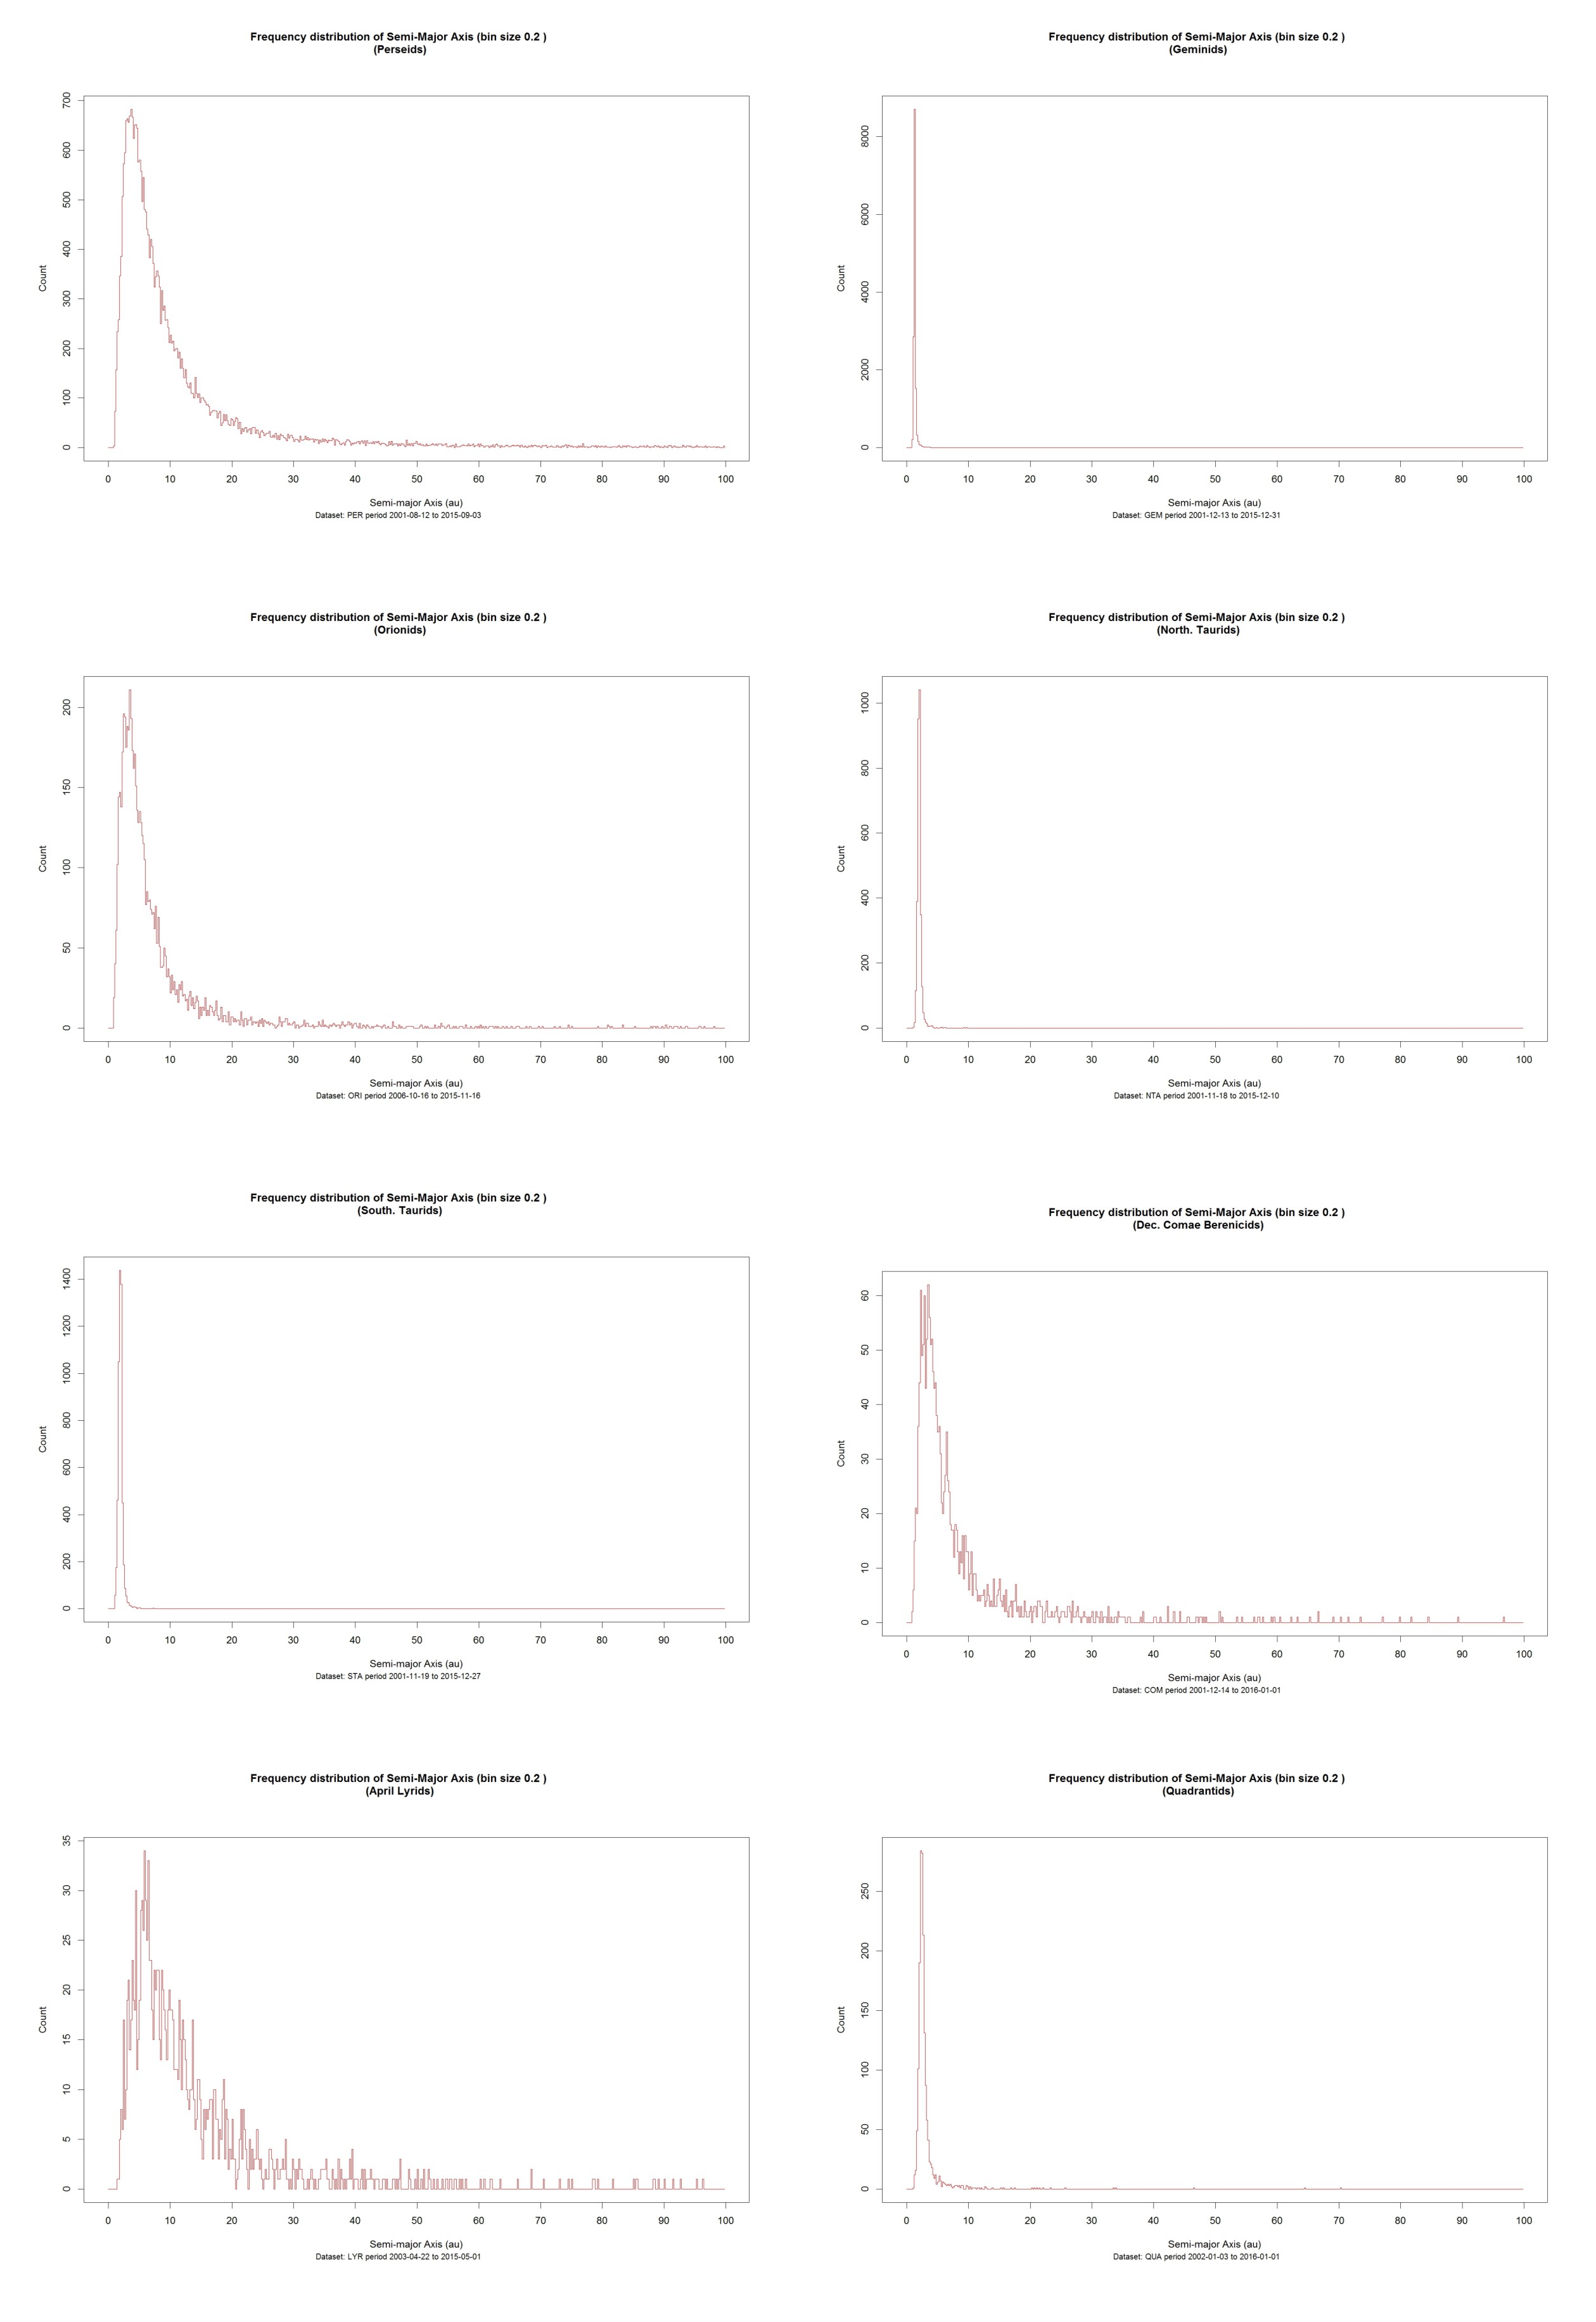
Figure 13: Frequency distribution of semi-major axis (a) with a fixed bin size. Author: Jakub Koukal
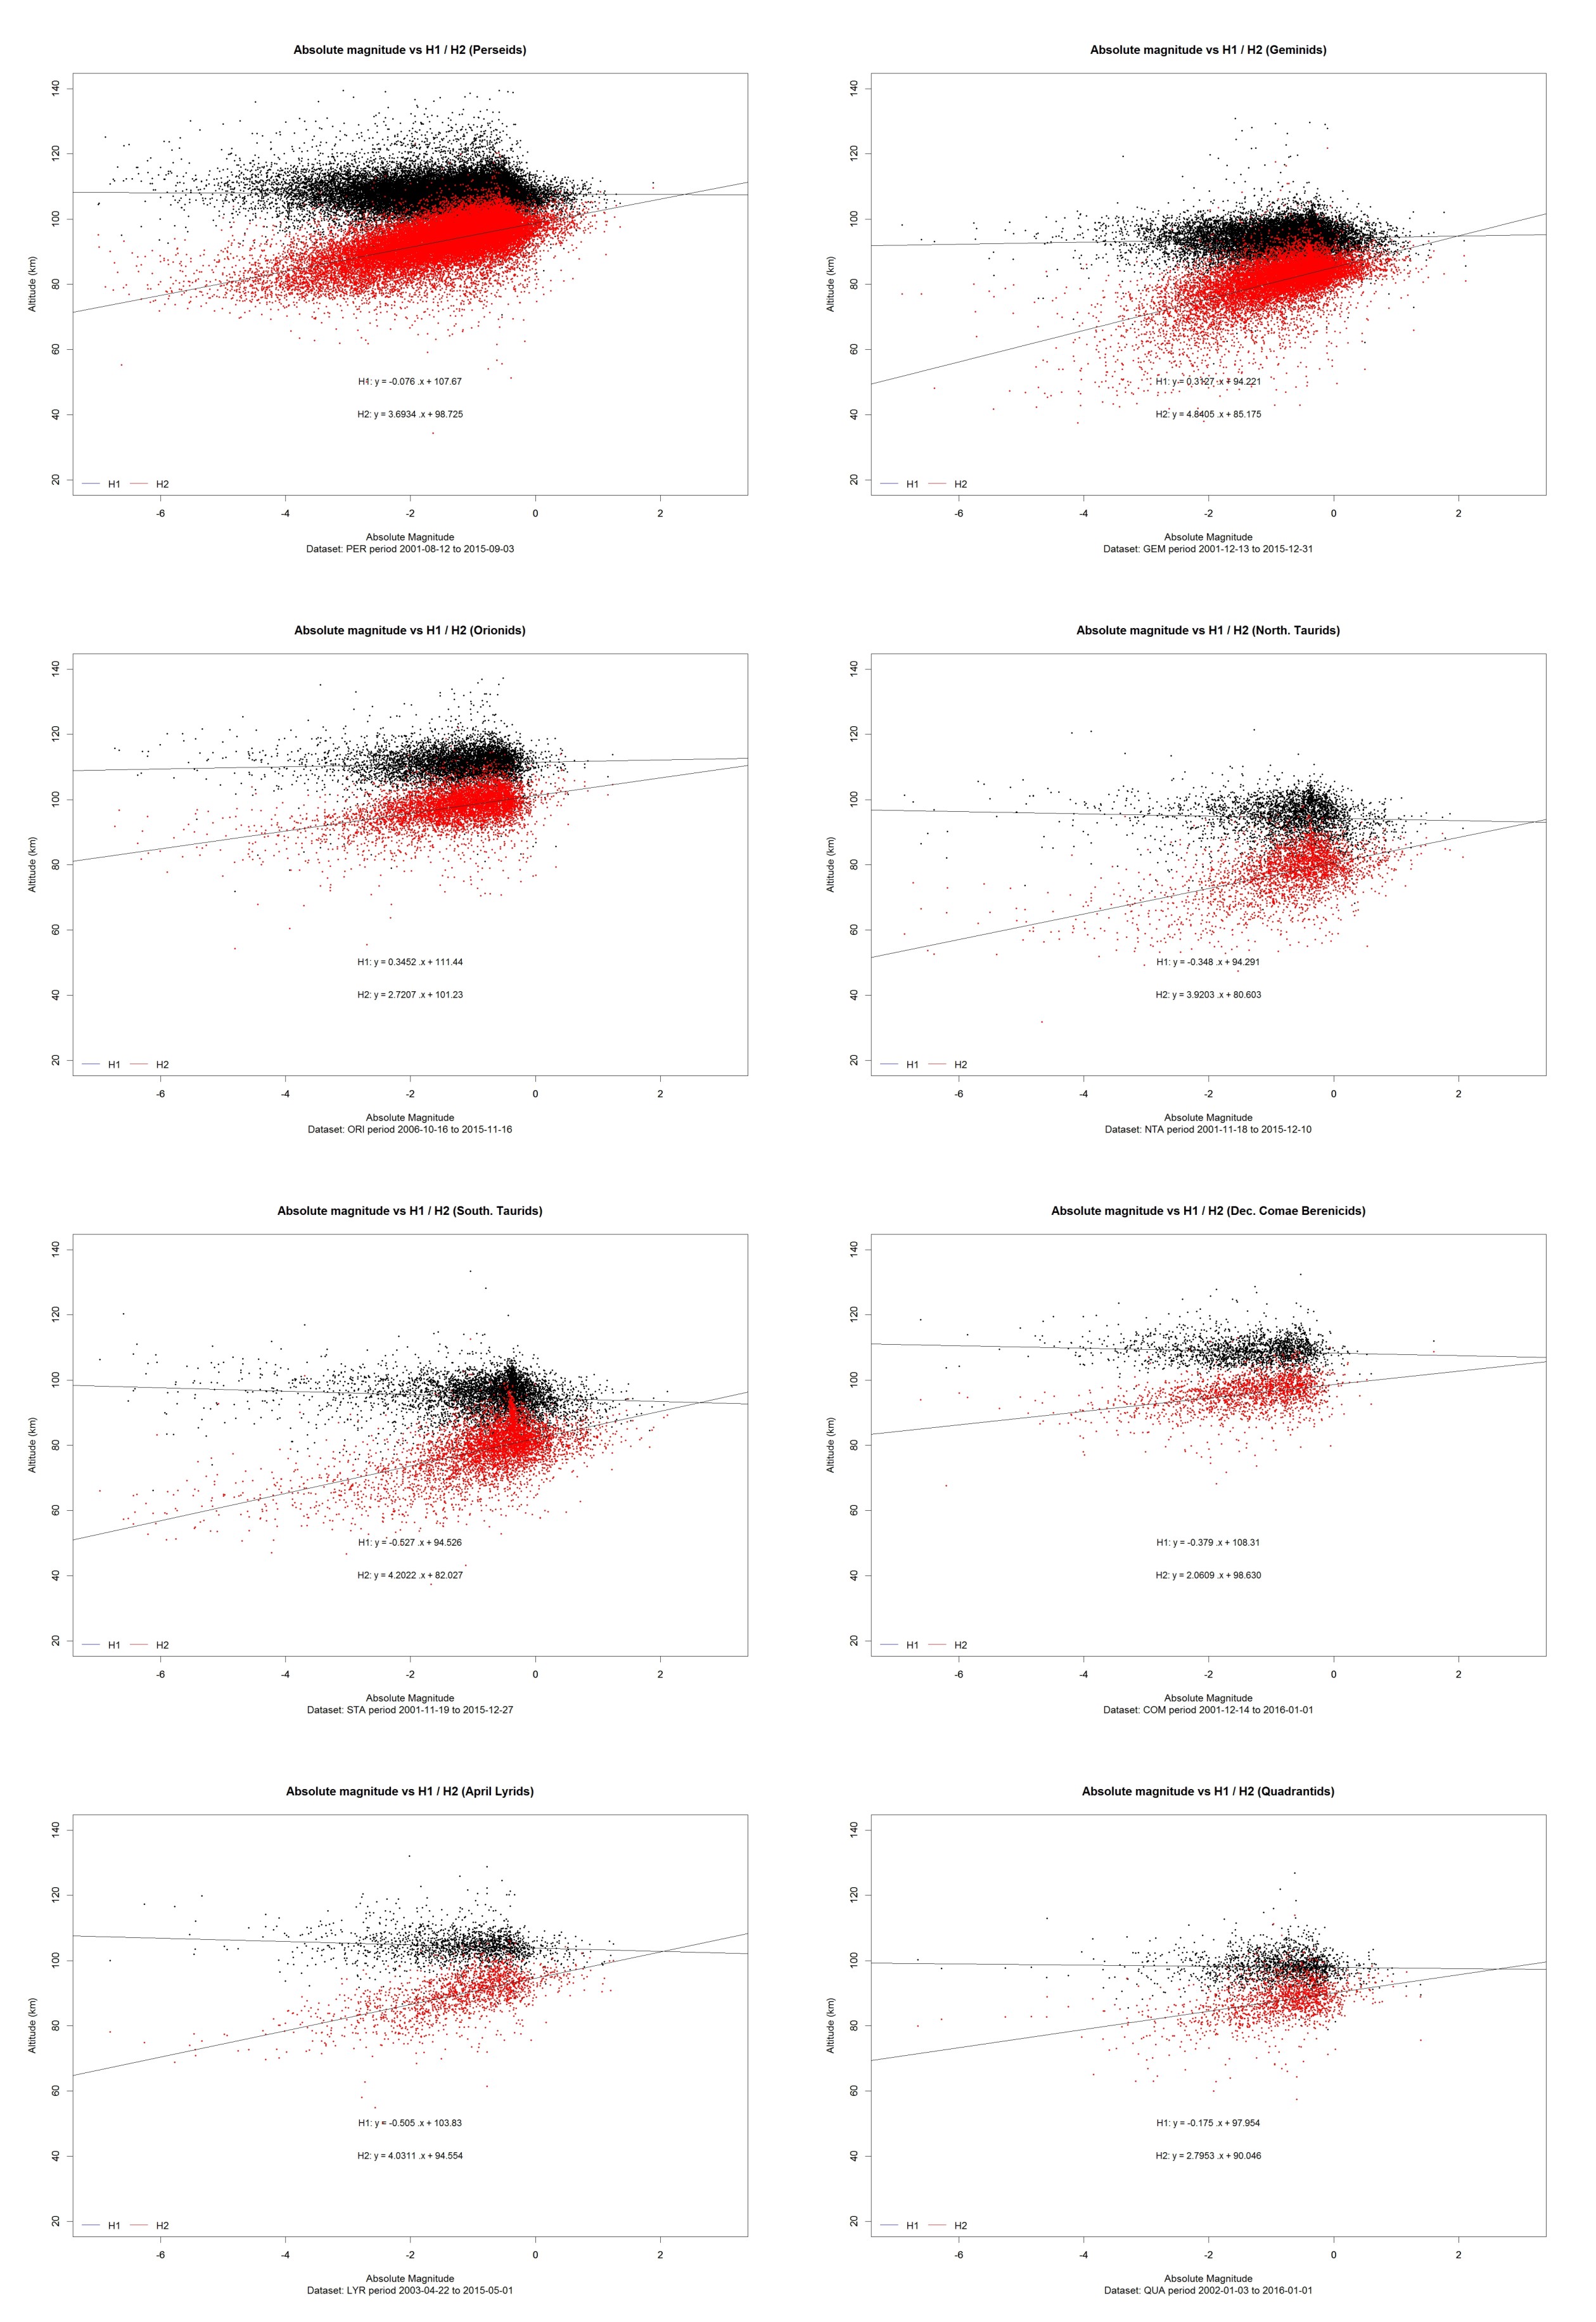
Figure 14: Scatter plot of absolute magnitude (amag) vs start height (H1) and end height (H2). Author: Jakub Koukal
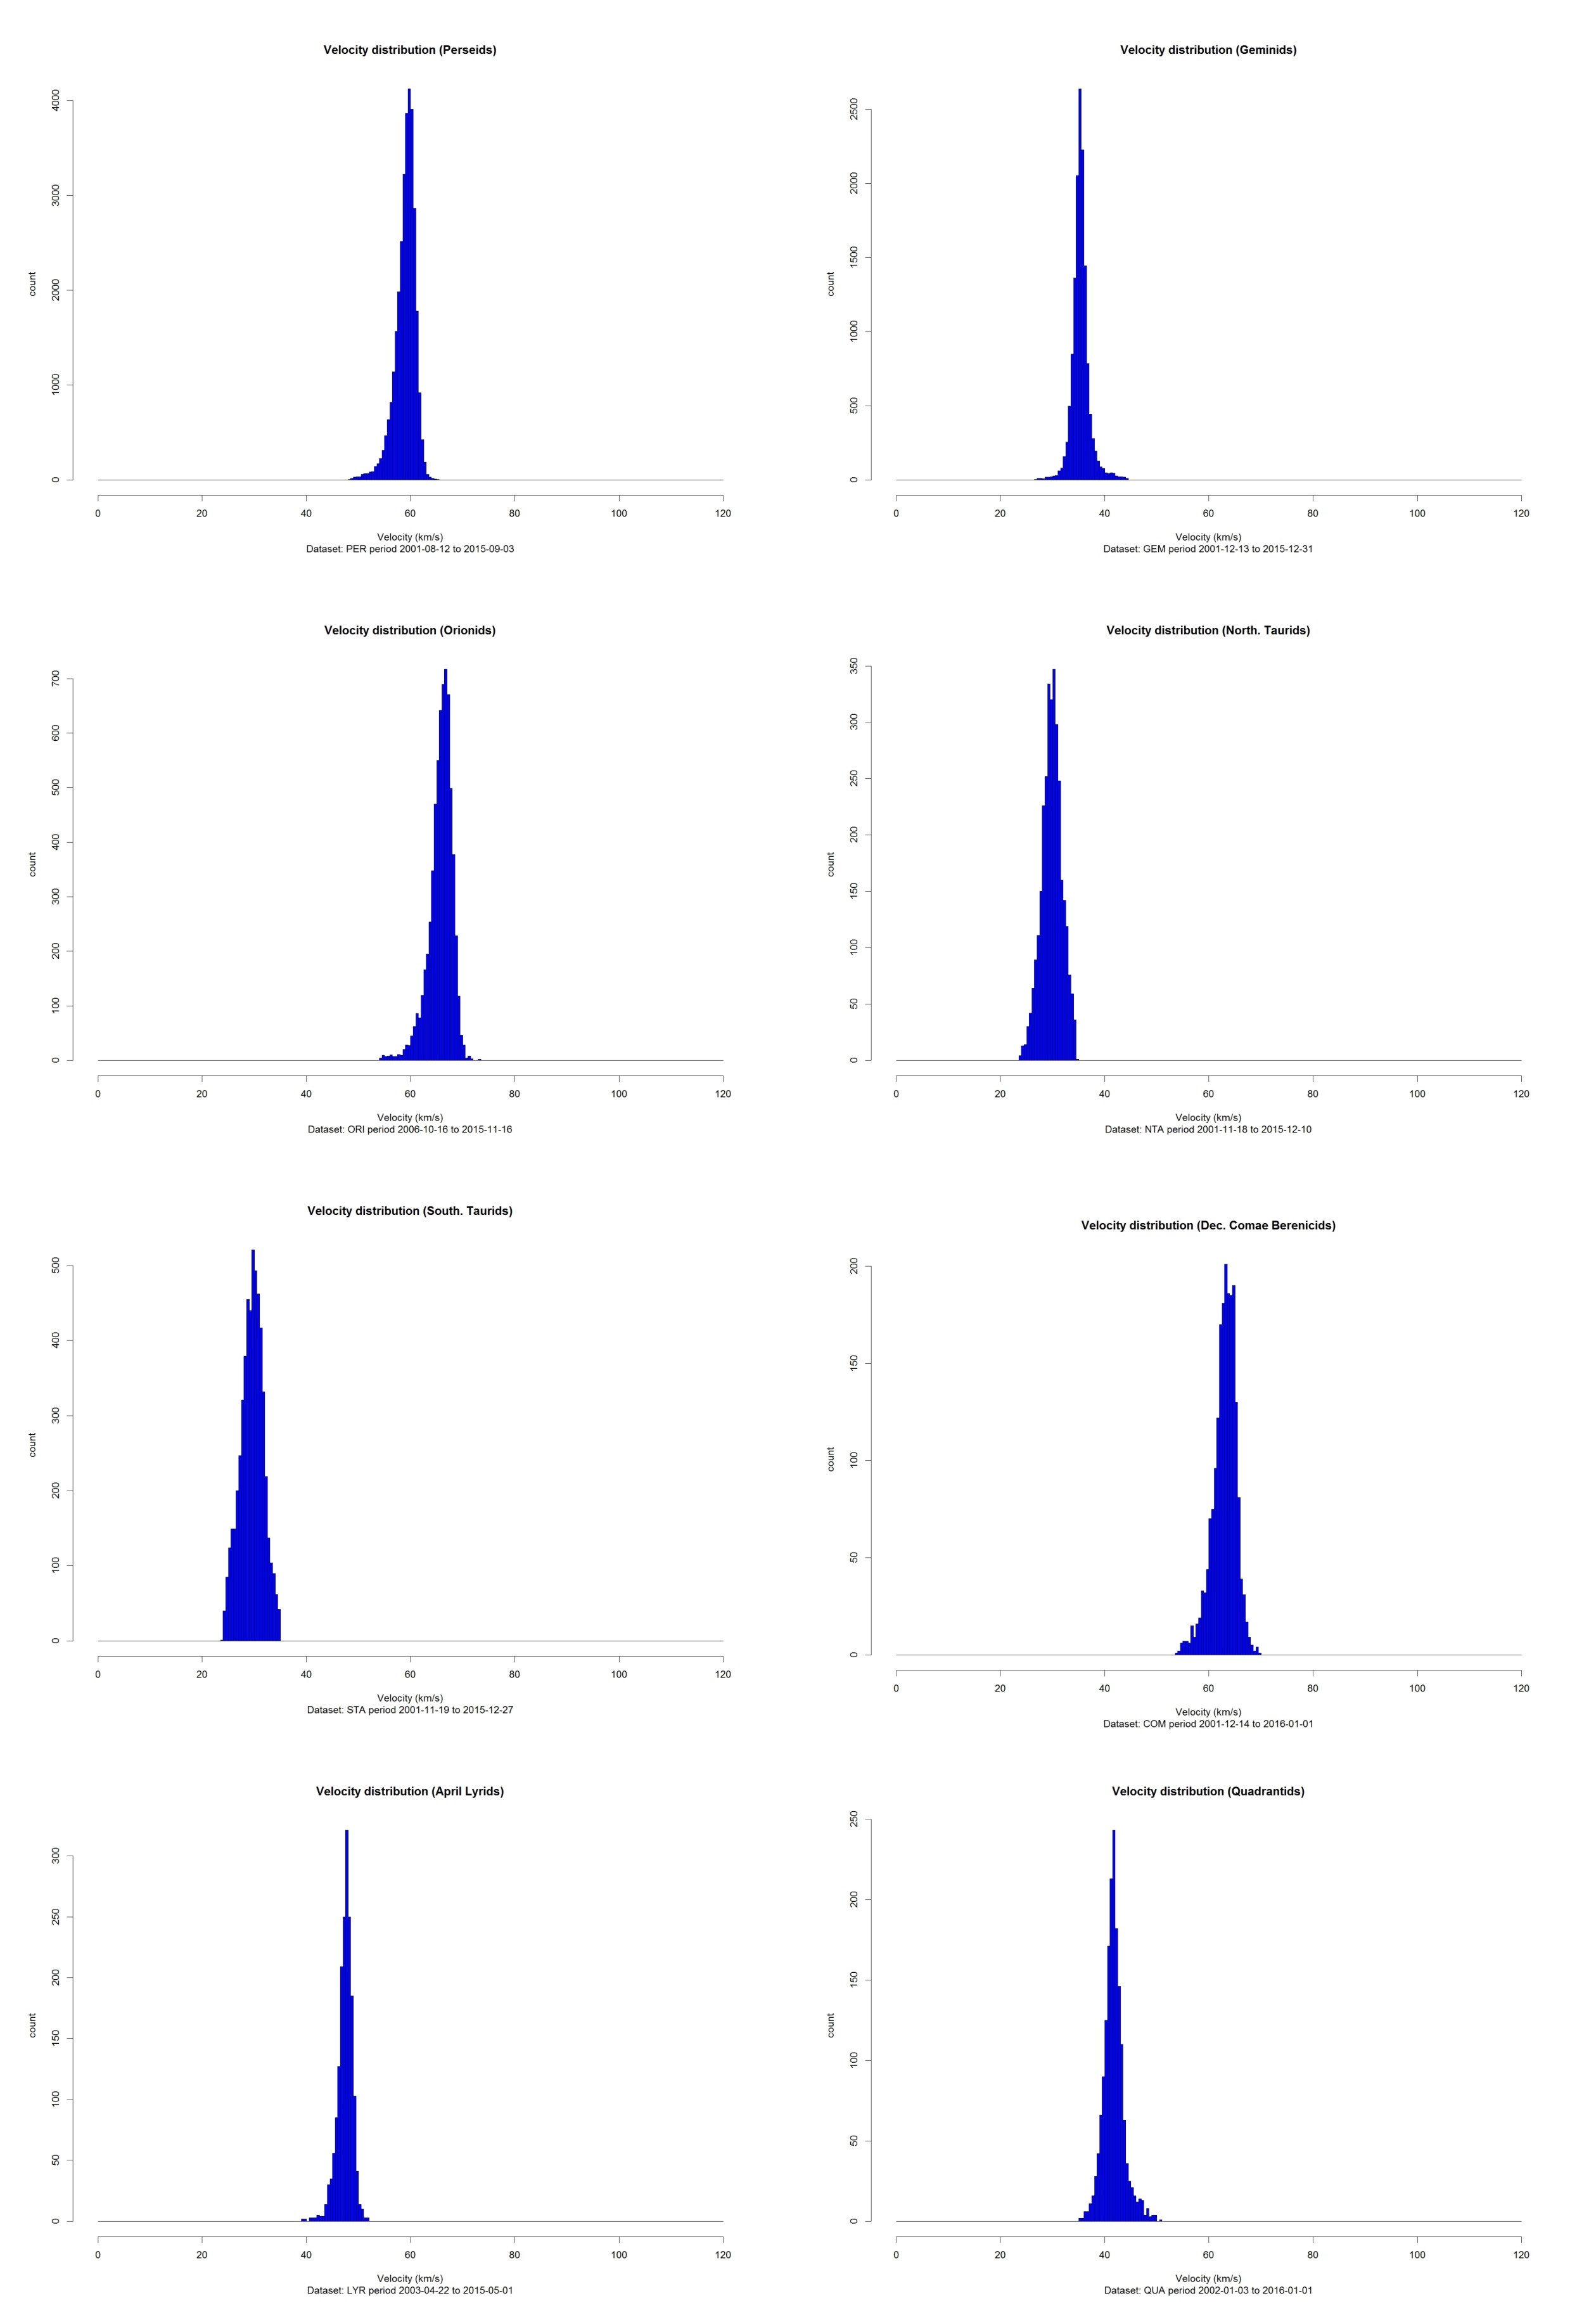
Figure 15: Frequency distribution of geocentric velocities (vg). Author: Jakub Koukal
Acknowledgement
We would like to thank to all operators of all national networks and independent databases that are listed in the “European Video Meteor Network Database” whose long term and precise work enabled compilation of the EDMOND database. Also we would like to thank to all institutions involved for still growing support of network activities.
References
Campbell-Burns P., Káčerek R. (2016). “R suite for the Reduction and Analysis of UFO Orbit Data”. WGN, Journal of the International Meteor Organization, 44:1, 2016, pages 16-20.
Kornoš L., Koukal J., Piffl R., and Tóth J. (2014a). “EDMOND Meteor Database”. In Gyssens M. and Roggemans P., editors, Proceedings of the International Meteor Conference, Poznań, Poland, Aug. 22-25, 2013. IMO, pages 23–25.
Kornoš L., Matlovič P., Rudawska R., Tóth J., Hajduková M. Jr., Koukal J., and Piffl R. (2014b). “Confirmation and characterization of IAU temporary meteor showers in EDMOND database”. Proceedings of the Meteoroids 2013 Conference, Aug. 26-30, 2013, A.M. University, Poznań, Poland, eds. Jopek T.J., Rietmeijer F.J.M., Watanabe J., Williams I.P., page 225-233.
Molau S. (1999). “The meteor detection software MetRec”. Proceedings of the Meteoroids International Conference, Tatranska Lomnica, Aug. 17-21, 1998, eds. Baggaley W. J. and Porubcan V., Astronomical Institute of the Slovak Academy of Sciences, 1999, page 131.


